https://github.com/ai-hypercomputer/cloud-diagnostics-xprof
https://github.com/ai-hypercomputer/cloud-diagnostics-xprof
Last synced: about 1 year ago
JSON representation
- Host: GitHub
- URL: https://github.com/ai-hypercomputer/cloud-diagnostics-xprof
- Owner: AI-Hypercomputer
- License: apache-2.0
- Created: 2025-03-03T22:51:34.000Z (over 1 year ago)
- Default Branch: main
- Last Pushed: 2025-06-25T19:33:11.000Z (about 1 year ago)
- Last Synced: 2025-06-25T20:31:15.988Z (about 1 year ago)
- Language: Python
- Homepage: https://pypi.org/project/cloud-diagnostics-xprof/
- Size: 1.46 MB
- Stars: 7
- Watchers: 1
- Forks: 1
- Open Issues: 0
-
Metadata Files:
- Readme: README.md
- Contributing: docs/CONTRIBUTING.md
- License: LICENSE
Awesome Lists containing this project
README
# xprofiler
The `xprofiler` tool aims to simplify profiling experience for XLA workloads.
It provides an abstraction over profile sessions and manages
[`xprof` hosting](https://github.com/openxla/xprof) experience.
This includes allowing users to create and manage VM instances that
are preprovisioned with TensorBoard and latest profiling tools.
For more information about profiling with `xprof`, please see the `xprof`
[documentation](https://github.com/openxla/xprof/blob/master/docs/).
## Quickstart
Xprofiler can be setup on user's workstation/cloudtop or on your TPU VM.
> Note:
> Before setting up `xprofiler`, users will need to enable profile collection
> for their workload by starting the profile server
> (see [section on enabling this collector](#prerequisite-enable-collector))
> or capturing programmatically
> (see [section on programmatic profile capture](#programmatic-profile-capture)).
### Install Dependencies
`xprofiler` relies on using [gcloud](https://cloud.google.com/sdk).
The first step is to follow the documentation to [install](https://cloud.google.com/sdk/docs/install).
Running the initial `gcloud` setup will ensure things like your default project
ID are set.
```bash
# setup project context
gcloud init
# setup auth for gcloud
gcloud auth
# Setup auth for client libraries
gcloud auth application-default login
```
### Setup cloud-diagnostic-xprof Package
Use a virtual environment (as best practice).
```bash
python3 -m venv venv
source venv/bin/activate
# Install package
pip install cloud-diagnostics-xprof
# Confirm installed with pip
pip show cloud-diagnostics-xprof
Name: cloud-diagnostics-xprof
Version: X.Y.Z
Summary: Abstraction over profile session locations and infrastructure running the analysis.
Home-page: https://github.com/AI-Hypercomputer/cloud-diagnostics-xprof
Author: Author-email: Hypercompute Diagon
```
### Permissions
`xprofiler` relies on project level IAM permissions.
* VM's service account must have required permissions.
* ``-compute@developer.gserviceaccount.com is the default
service account. Users can also use custom Service Accounts for their setup.
* Service Account must have `Storage Object User` role on input GCS bucket.
This is needed to read/write profile traces to GCS.
* Users must have `Service Account User` role on above service account. This is
needed to access reverse proxy URL link for visualization.
* Users must have `Storage Object User` role on input GCS bucket. This is
needed to validate xprofiler instance state during setup.
> Summary:
>
> Users need to ensure when using `xprofiler` that it's in the _same project_ as
> their GCS bucket.
>
> Users also need to ensure they put the required permissions for their GCS
> bucket so the `xprofiler` VM can access the bucket.
### Recommendations
#### GCS Paths
`xprofiler` uses a specific path pattern to locate and manage multiple profiling
sessions stored within a Google Cloud Storage (GCS) bucket. This enables the
visualization of various profiling sessions from different runs using a single
`xprofiler` instance.
##### GCS Paths for `xprofiler create`
It's recommended when using the `xprofiler create` subcommand to specify only
the root GCS bucket, without any subdirectories:
```
gs://
```
This approach allows `xprofiler` to discover and load profiles from multiple
runs and sessions stored under that bucket.
For instance, all the profile as organized below would be loaded in our example:
* `gs:///run1/plugins/profile/session1//run1/plugins/profile/session2//run2/plugins/profile/session1/` during `xprofiler create` will allow users to
view all of these profiles in TensorBoard. They will see all runs in the
dropdown menu as `run1/session1`, `run1/session2`, and `run2/session1`.
##### GCS Paths for Profile Capture
When users programmatically capture profiles or use the `xprofiler capture`
subcommand with a GCS bucket path like `gs:///`, all
profiling data will be collected in a structured subdirectory:
```
gs:////tensorboard/plugins/profile//
```
Users will see the run in the dropdown menu as
`/tensorboard//`.
Here, the `` uniquely identifies a specific profiling session within
that run.
> Note:
> As long as users have xplane files that follow the pattern
> `.../plugins/profile/` under the bucket path from
> `xprofiler create`, all the profiles will be picked up in any subdirectories.
##### Examples of proper and improper GCS paths
Quick note on examples of proper and improper GCS paths (for log directory
parameter):
```bash
# Proper path (note forward slash at end is optional)
gs://my-bucket/main_directory/sub-a/sub-b/
# Proper path
gs://my_other_bucket/main_directory/sub-1/sub-2
# Improper path: does not start with gs://
my_other_bucket/main_directory/sub-1/sub-2
```
#### Machine Types
During creation, users have the option to specify the VM machine type.
The selection of a machine type can impact both performance and cost, and the
optimal choice often correlates with the size of the profiles users anticipate
working with.
By default, `xprofiler` utilizes the `c4-highmem-8` machine type. This
configuration is generally robust and should provide sufficient resources for a
wide range of common profile sizes.
However, users may find it beneficial to select a different machine type based
on their specific needs:
* For workloads involving relatively small profiles (e.g., under approximately
100MB), a less powerful machine like `e2-highmem-4` might be a cost-effective
alternative without significantly compromising performance for those tasks.
* Conversely, users with particularly large profiles can opt for a more capable
machine (such as `c4-highmem-32`) could lead to faster processing times.
* Although the default machine type should be sufficient for most users, if
users find it taking more than **3 minutes** for profiles to load then they
may want to try a more powerful machine type for the `xprofiler` VM.
The following table offers some general suggestions.
Please consider these as rough guidelines rather than strict prescriptions, as
the ideal machine type can depend on multiple factors specific to users'
profile data. Users may want to try more powerful machine types if it takes more
than ***3 minutes*** to load.
| Profile Size | Suggested Machine Type | Primary Consideration |
|---|---|---|
| Small (< ~100 MB) | e2-highmem-4 | Cost-effectiveness |
| Medium / Typical | c4-highmem-8 (Default) | Balanced performance & cost |
| Large (> 1 GB)| c4-highmem-32 | Higher processing power |
While we generally recommend utilizing a
[general-purpose machine type](https://cloud.google.com/compute/docs/general-purpose-machines),
users are free to explore and specify other machine types that better suit their
requirements. A comprehensive list of machine types can be found in the
[Google Cloud documentation](https://cloud.google.com/compute/docs/machine-resource).
For more information about specifying a machine type for `xprofiler create`,
please refer to the [section below](#xprofiler-create---machine-type) on
`xprofiler create --machine-type`.
### Create `xprofiler` Instance
To create a `xprofiler` instance, you must provide a path to a GCS bucket and
zone. Project information will be retrieved from `gcloud`'s config.
```bash
ZONE=""
GCS_PATH="gs://"
xprofiler create -z $ZONE -l $GCS_PATH
```
When the command completes, you will see it return information about the
instance created, similar to below:
```
Waiting for instance to be created. It can take a few minutes.
Instance for gs:// has been created.
You can access it via following,
1. https://-dot-us-.notebooks.googleusercontent.com.
2. xprofiler connect -z -l gs:// -m ssh
Instance is hosted at xprof-97db0ee6-93f6-46d4-b4c4-6d024b34a99f VM.
```
> Note: Depending on availability, the zone specified might not have the default
> machine type for the VM. In that case, you instead might see an error followed
> by potential zones that the machine type is available.
>
> For more details, see [section](#xprofiler-create-machine-type) on machine
> types when using `xprofiler create`.
This will create a VM instance with `xprofiler` packages installed. The setup
can take up to a few minutes. The link above is shareable with anyone with IAM
permissions.
By default, `xprofiler` instances will be hosted on a c4-highmem machine. Users
can also specify a machine type of their choice using the -m flag.
During `create`, users will be prompted if they would like to create a second
instance for the same GCS path. Pressing anything but `Y` or `y` will exit the
program.
```
$ xprofiler create -z -l gs://
Instance for gs:// already exists.
Log_Directory URL Name Zone
------------------ ------------------------------------------------------------ ------------------------------------------ -------
gs:// https://-dot-us-.notebooks.googleusercontent.com xprof-97db0ee6-93f6-46d4-b4c4-6d024b34a99f
Do you want to continue to create another instance with the same log directory? (y/n)
y
Waiting for instance to be created. It can take a few minutes.
Instance for gs:// has been created.
You can access it via following,
1. https://-dot-us-.notebooks.googleusercontent.com.
2. xprofiler connect -z -l gs:// -m ssh
Instance is hosted at xprof- VM.
```
### Open `xprofiler` Instance
##### Using Proxy
Users can open created instances using the link from create output. This path
relies on a reverse proxy to expose the xprofiler backend. Users must have
valid IAM permissions.
##### Using SSH Tunnel (Preferred for larger captures)
Users can connect to an instance by specifying a log_directory.
* Connect uses an SSH tunnel and users can open a localhost url from their
browsers.
> Note: `-z (--zone)` and `-l (--log_directory)` are mandatory arguments.
```
xprofiler connect -z $ZONE -l $GCS_PATH -m ssh
xprofiler instance can be accessed at http://localhost:6006.
```
> Note:
> Running `xprofiler connect` using the SSH tunnel must be done in your local
> host and ***not*** on a TPU VM.
>
> Running `xprofiler connect` using the SSH option allows users to open the
> `xprofiler` web server and accessed on user's local browser.
> Therefore, running the `xprofiler connect` subcommand on a TPU VM is not
> particularly useful and won't work as expected if the command is done on a TPU
> VM.
### List `xprofiler` Instances
To list the `xprofiler` instances, you will need to specify a zone. Users can
optionally provide bucket information and/or VM instance names.
```bash
ZONE=us-central1-a
xprofiler list -z $ZONE
```
> Note: The `-z (--zones)` flag is not required but is highly recommended.
> If a zone is not provided, the command can take longer to search for all
> relevant VM instances.
This will output something like the following if there are instances matching
the list criteria:
```bash
Log_Directory URL Name Zone
------------------------ ------------------------------------------------------------------- ------------------------------------------ -------
gs:// https://-dot-us-.notebooks.googleusercontent.com xprof-97db0ee6-93f6-46d4-b4c4-6d024b34a99f
gs:// https://-dot-us-.notebooks.googleusercontent.com xprof-ev86r7c5-3d09-xb9b-a8e5-a495f5996eef
```
Note you can specify one or more GCS bucket paths and/or VM instance names to
get any VMs associated with the criteria provided. This will list any VMs
associated with the log directories or VM names specified.
(See [section](#optionally-specifying-log-directories-andor-vm-names) below for
more details.)
```bash
# Specifying one GCS path
xprofiler list -z $ZONE -l $GCS_PATH
# Specifying one VM instance name
xprofiler list -z $ZONE --vm-name $VM_NAME
```
### Delete `xprofiler` Instance
To delete an instance, you'll need to specify either the GCS bucket paths or the
VM instances' names. Specifying the zone is required.
```bash
# Delete by associated GCS path
xprofiler delete -z us-central1-b -l gs://
Found 1 VM(s) to delete.
Log_Directory URL Name Zone
------------------ ------------------------------------------------------------------- ------------------------------------------ -------
gs:// https://-dot-us-.notebooks.googleusercontent.com xprof-8187640b-e612-4c47-b4df-59a7fc86b253
Do you want to continue to delete the VM `xprof-8187640b-e612-4c47-b4df-59a7fc86b253`?
Enter y/n: y
Will delete VM `xprof-8187640b-e612-4c47-b4df-59a7fc86b253`
# Delete by VM instance name
VM_NAME="xprof-8187640b-e612-4c47-b4df-59a7fc86b253"
xprofiler delete -z $ZONE --vm-name $VM_NAME
```
### Capture Profile
Users can capture profiles programmatically or manually. Captured profile data
will be saved to the given GCS path from `--log-directory`. It will specifically
save to the path of `gs:////plugins/profile/`.
##### Prerequisite: Enable Collector
Users are required to enable the collector from their workloads following below
steps.
> Note: This is needed for both programmatic and manual captures, except for
> JAX.
> For JAX programmatic capture, users do not need to include `start_server`.
> Users using JAX only need this for manual profile capture methods.
```python
# To enable for a jax workload
import jax
jax.profiler.start_server(9012)
# To enable for a pytorch workload
import torch_xla.debug.profiler as xp
server = xp.start_server(9012)
# To enable for tensorflow workload
import tensorflow.compat.v2 as tf2
tf2.profiler.experimental.server.start(9012)
```
Below links have some more information about the individual frameworks:
* [JAX](https://docs.jax.dev/en/latest/profiling.html#manual-capture)
* [PyTorch](https://cloud.google.com/tpu/docs/pytorch-xla-performance-profiling-tpu-vm#starting_the_profile_server)
* [TensorFlow](https://www.tensorflow.org/guide/profiler#collect_performance_data)
##### Programmatic Profile Capture
Users can capture traces from their workloads by marking their code paths.
Programmatic capture is more deterministic and gives more control to users.
> Note: The code snippets below assume that code in the earlier
> [prerequisite section](#prerequisite-enable-collector)
###### JAX Profile Capture
```python
jax.profiler.start_trace("gs:///")
# Code to profile
...
jax.profiler.stop_trace()
```
Alternatively, use the `jax.profiler.trace()` context manager:
```python
with jax.profiler.trace("gs:///"):
# Code to profile
...
```
###### PyTorch Profile Capture
```python
xp.trace_detached(f"localhost:{9012}", "gs:///", duration_ms=2000)
# Using StepTrace
for step, (input, label) in enumerate(loader):
with xp.StepTrace('train_step', step_num=step):
# code to trace
...
```
Alternatively, wrap individual parts of the code with `xp.Trace`:
```python
# Using Trace
with xp.Trace('fwd_context'):
# code to trace
...
```
###### TensorFlow Profile Capture
```python
tf.profiler.experimental.start("gs:///")
for step in range(num_steps):
# Creates a trace event for each training step with the step number
with tf.profiler.experimental.Trace("Train", step_num=step):
train_fn()
tf.profiler.experimental.stop()
```
##### Manual Profile Capture
Users can also trigger profile capture on target hosts. There are two methods to
do this:
* Using the `xprofiler capture` command
- For [GCE](#profile-capture-via-xprofiler-gce) workloads
- For [GKE](#profile-capture-via-xprofiler-gke) workloads
* Using [TensorBoard's UI](#profile-capture-via-tensorboard-ui)
###### Profile Capture via TensorBoard UI
Users have the option to trigger a profile capture using TensorBoard's UI.
First, visit the proxy URL for a VM instance (created via `xprofiler`) to visit
the TensorBoard UI. Which will bring you to one of two pages.
**Scenario 1: GCS Has Profile Data**
If the GCS log directory associated with the VM instance has profile data
already available, you'll likely see a page similar to this with profile runs
ready to view:
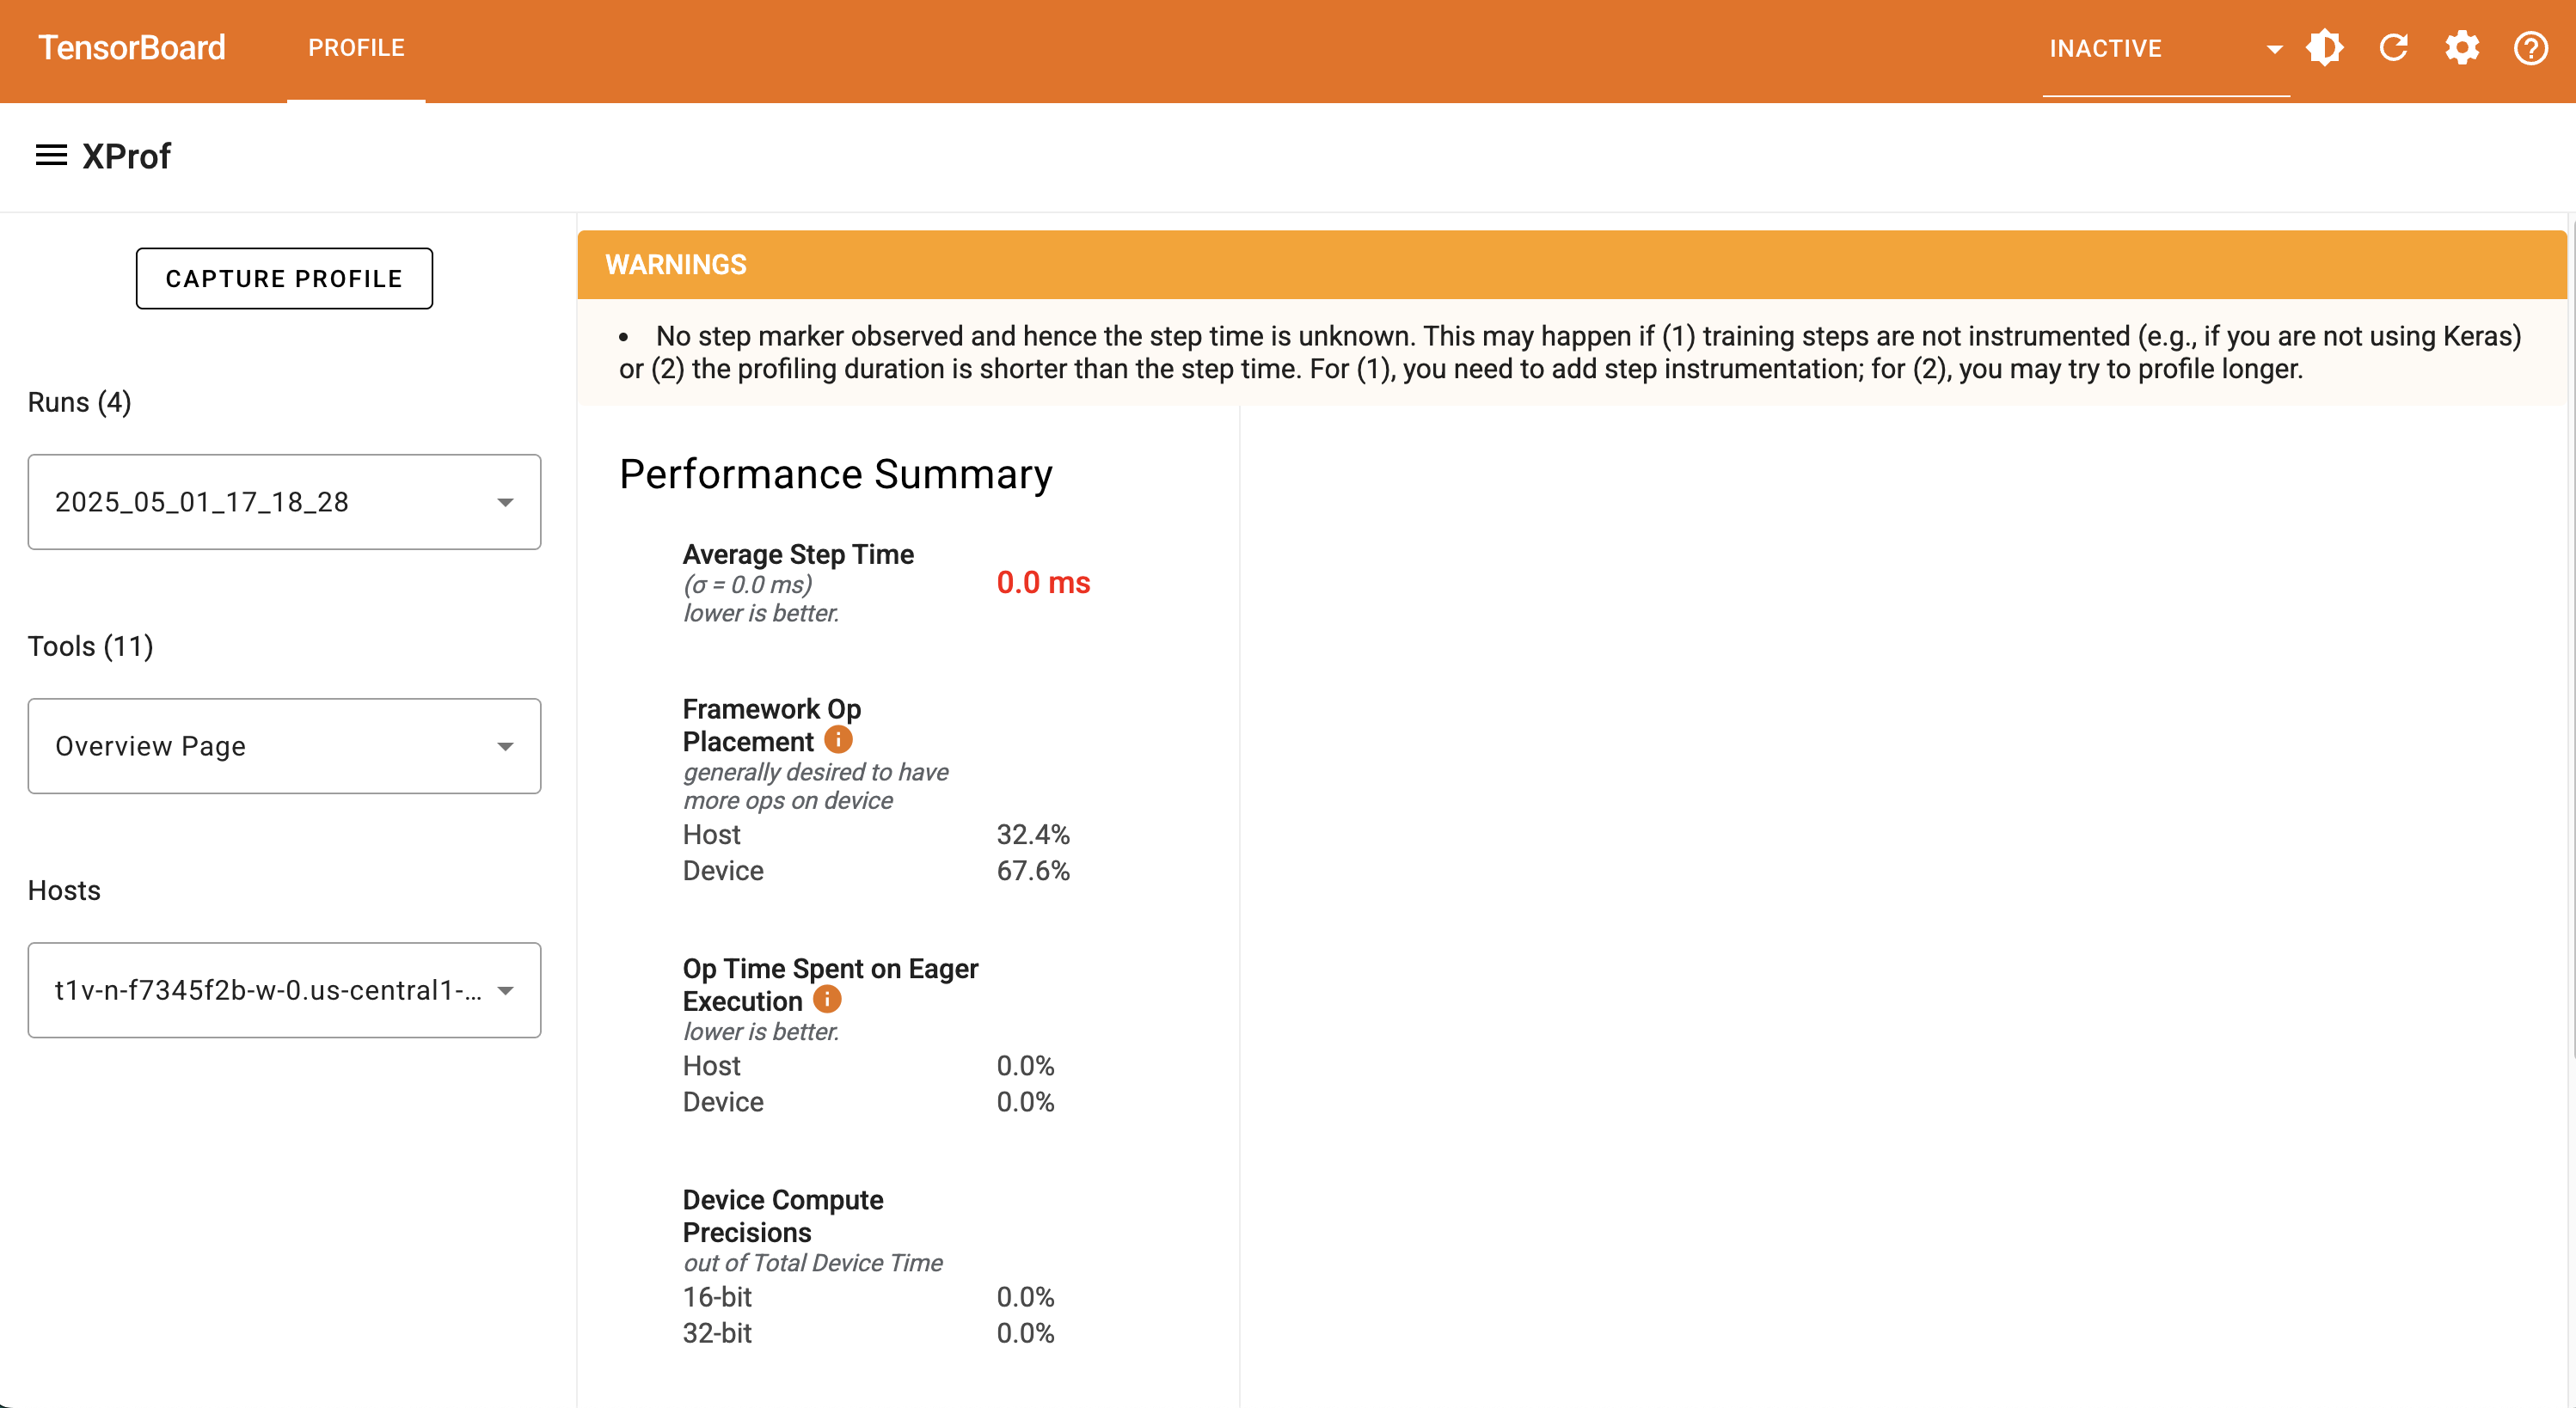
Notice the "CAPTURE PROFILE" button on the dashboard. You'll want to click that
& proceed with the next section on completing this form to capture profile data.
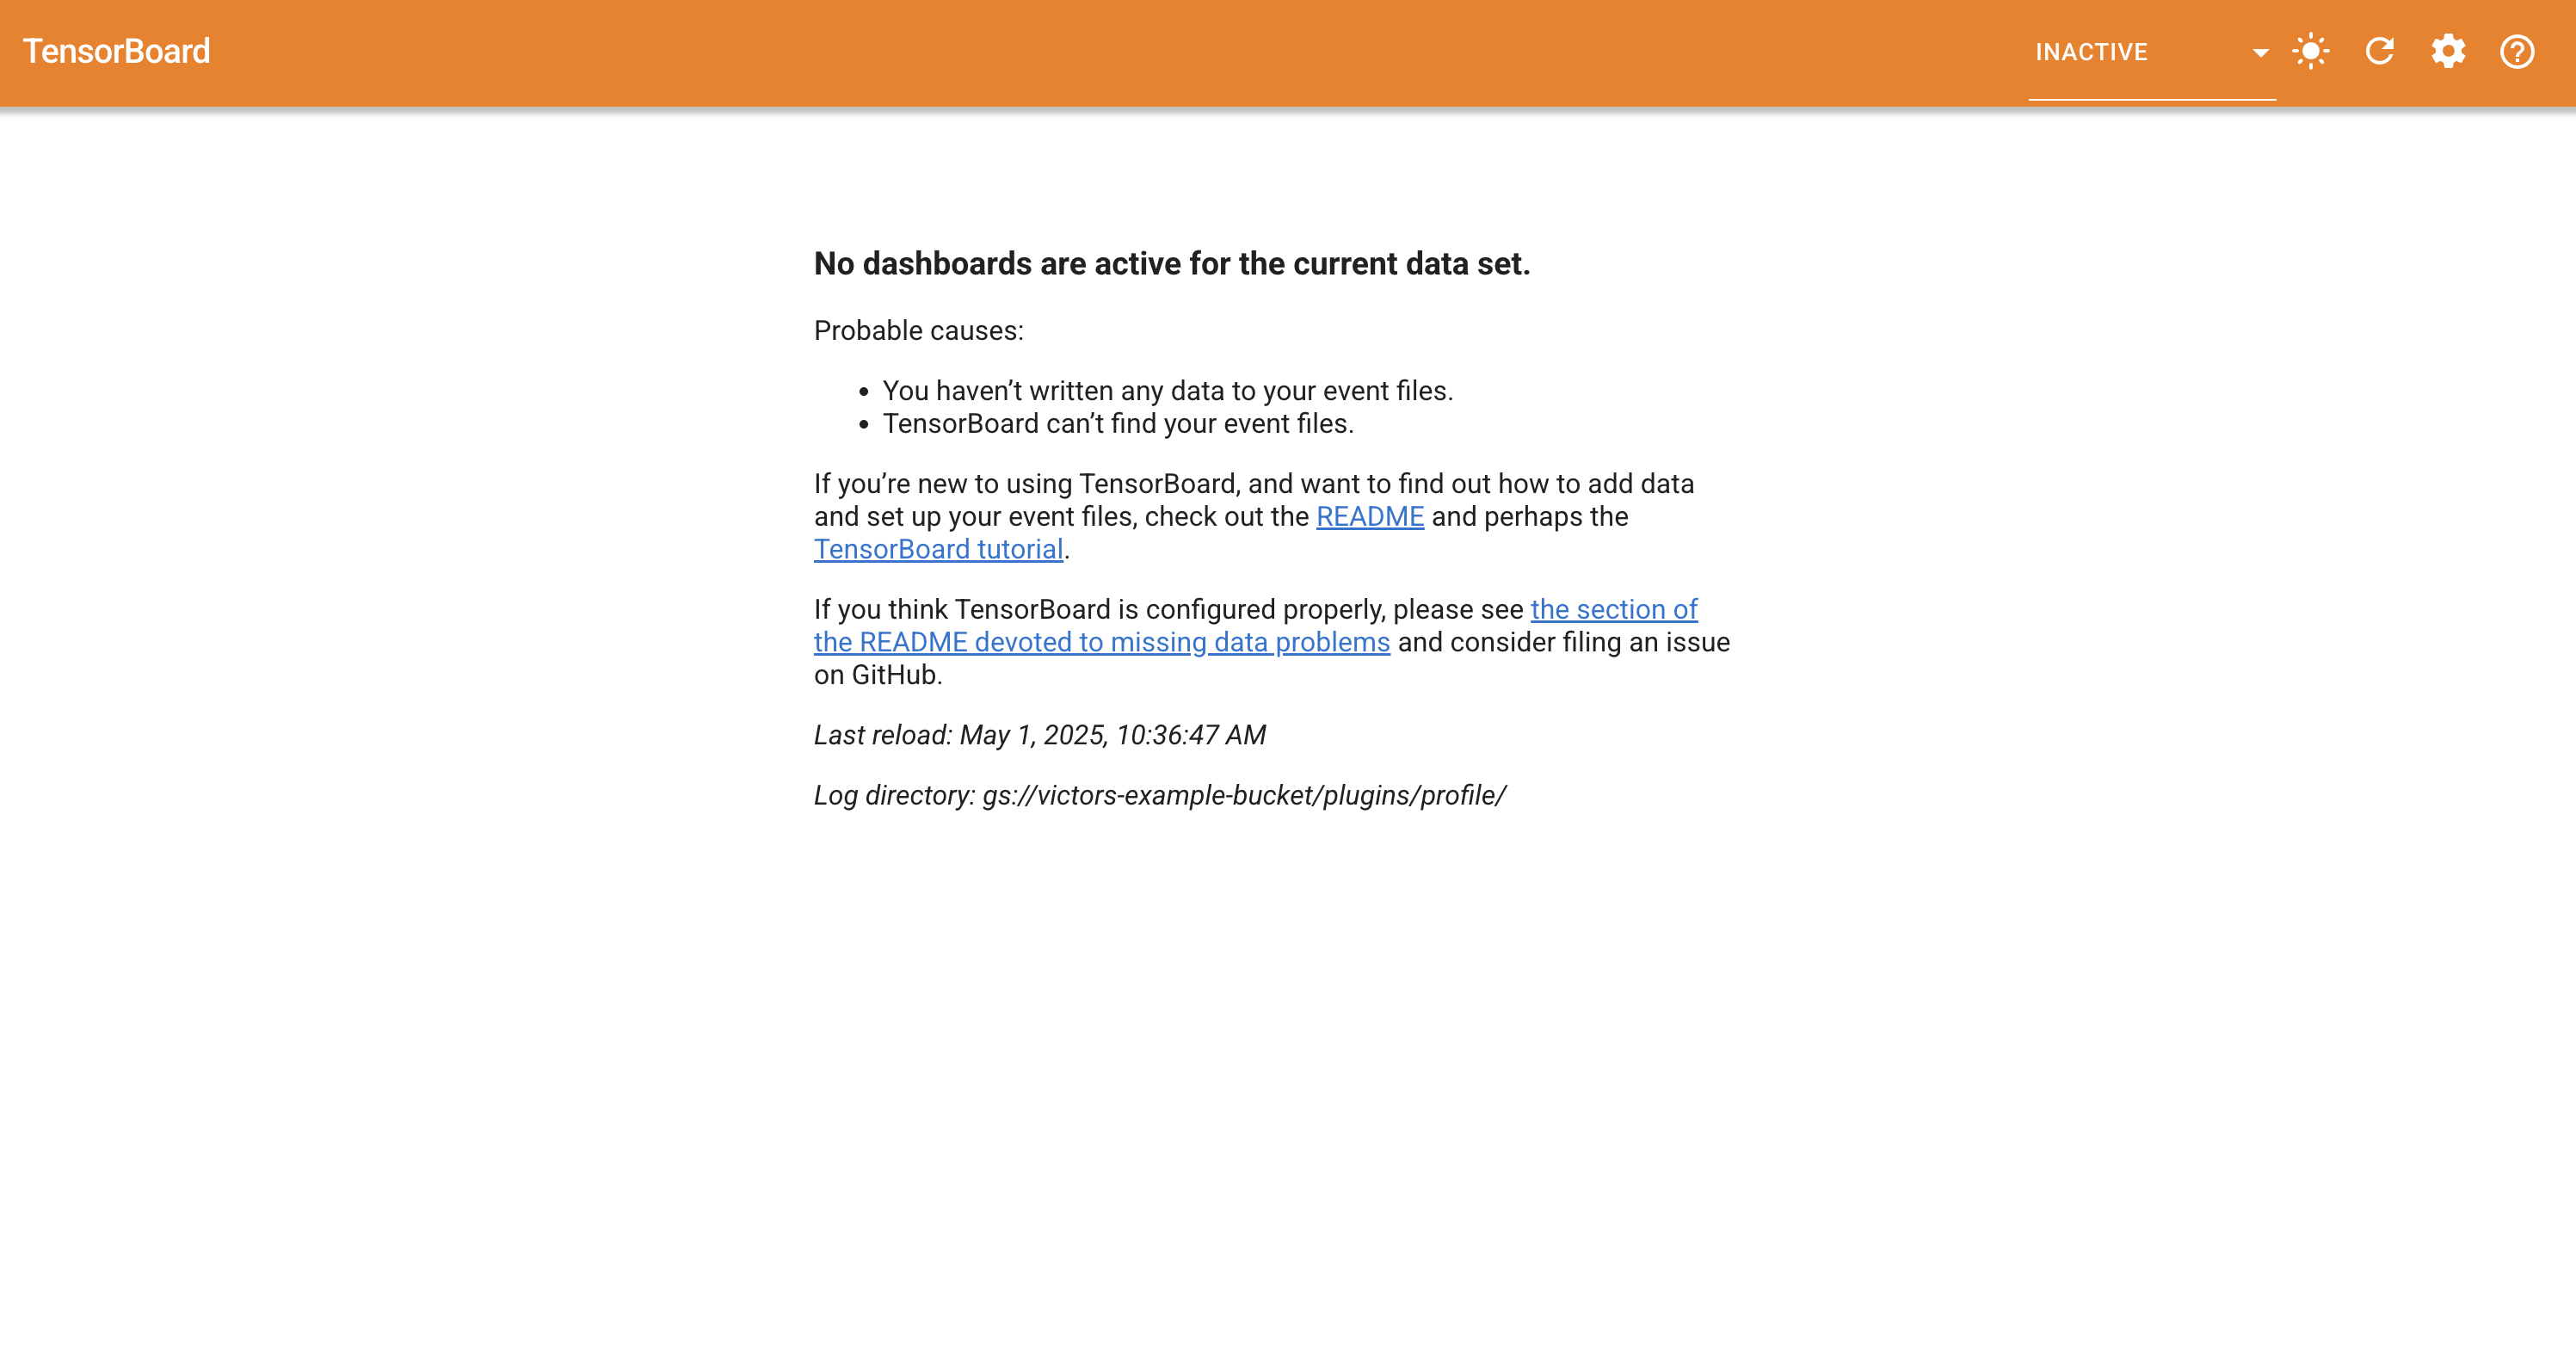
**Scenario 2: GCS Has No Profile Data**
You may see a similar page to this one with no dashboards if the GCS log
directory does not yet have any profile data:
You will then need to select the profile tab:
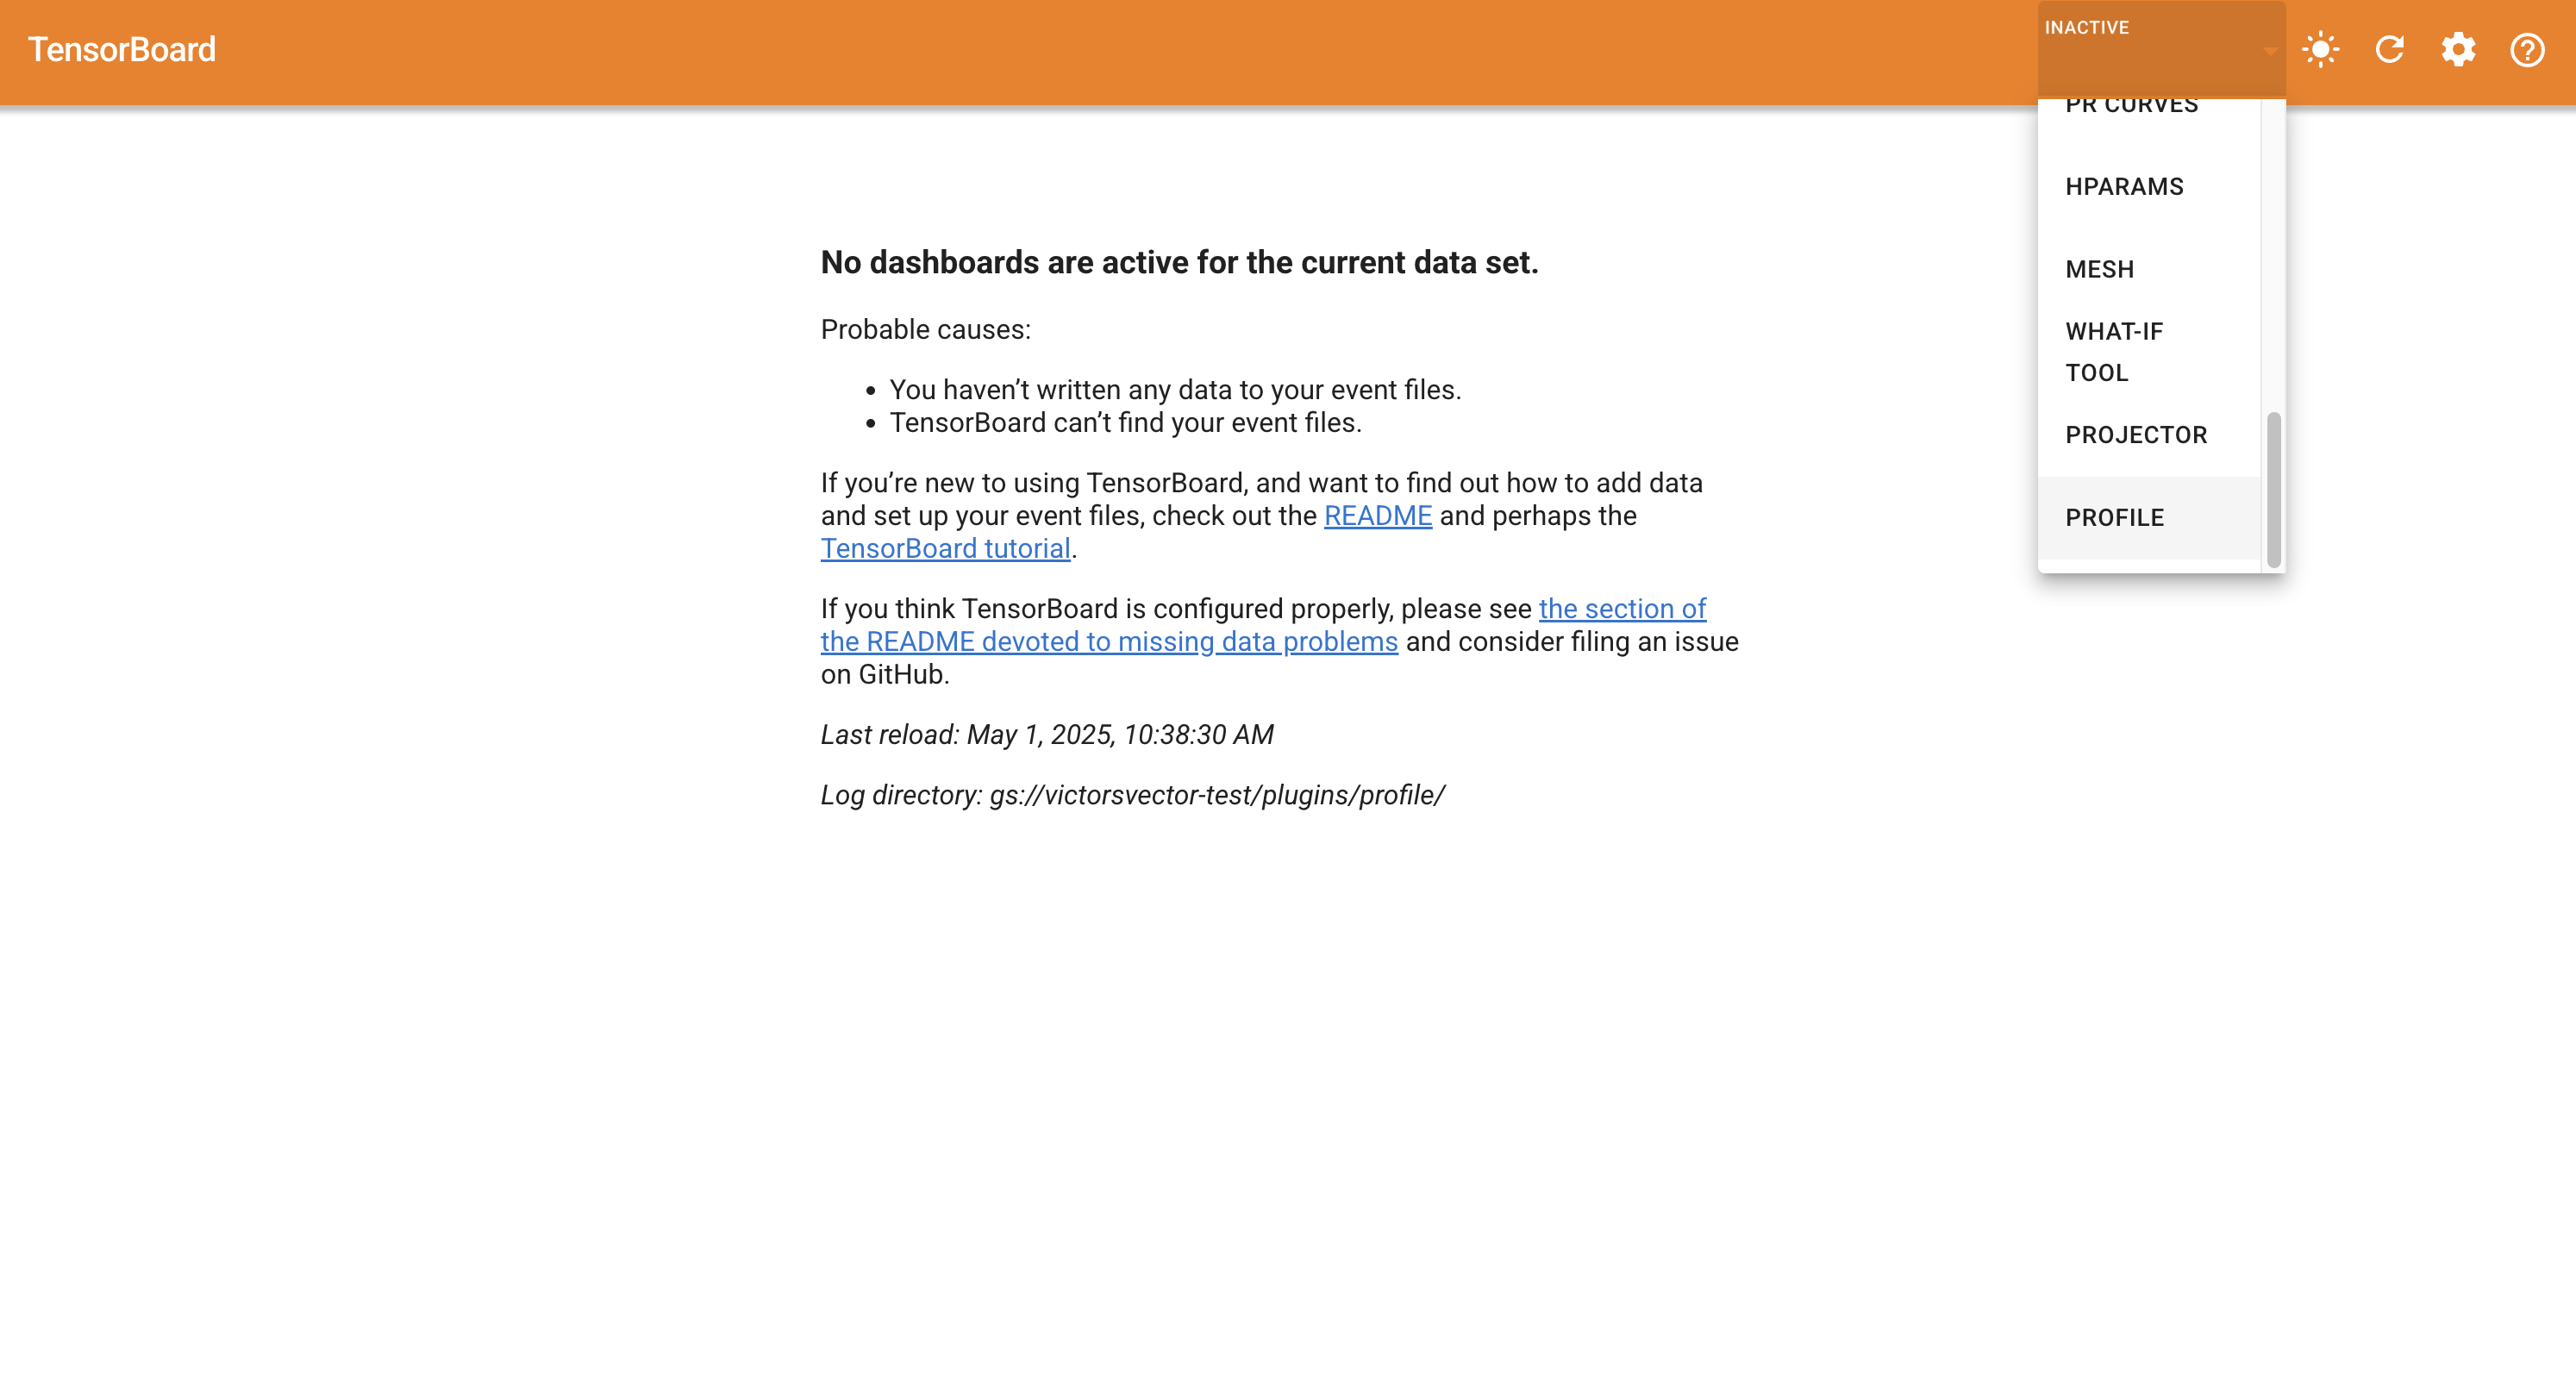
You'll then see a page similar to this one with a "CAPTURE PROFILE" button:

You want to click the "CAPTURE PROFILE" button which will bring up a form to
fill. Proceed to the next section for details in completing this form to capture
profile data.
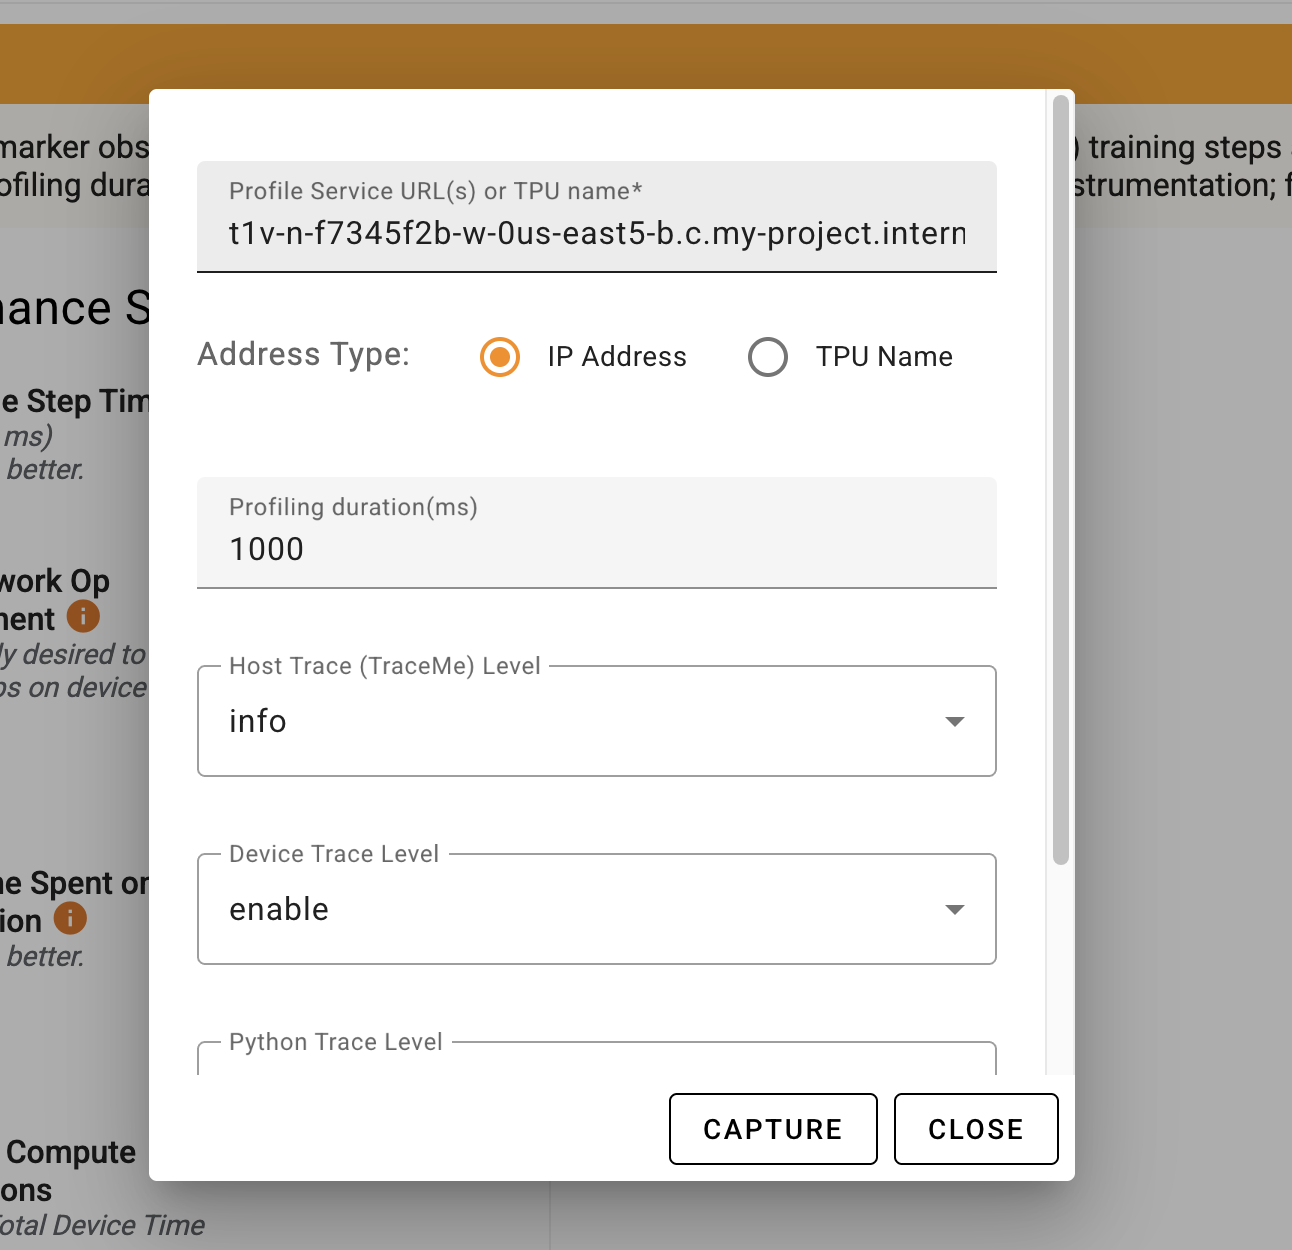
**Completing Form for Profile Capture**
In either case from above, you should see a similar form to fill to capture
profile data:
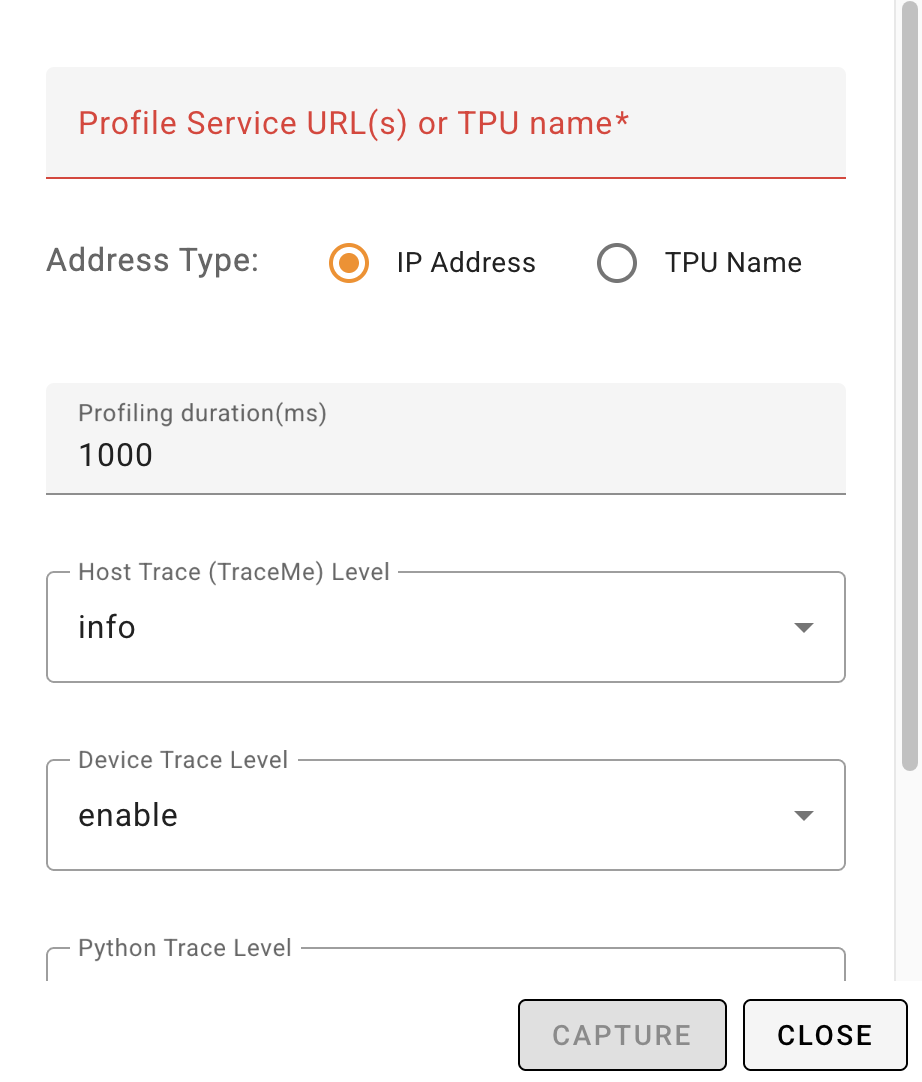
You will need to minimally provide the "Profile Service URL(s)" for the TPU VM
instance.
> Note:
> The instructions refer to the TPU VM that is _running_ the workload to
> profile and ***NOT*** the `xprofiler` VM instance.
You will need the full hostname for the TPU & port number
with the following format:
```
..c..internal:
```
* `TPU_VM_HOSTNAME`: This is different from the TPU name and refers to the host
that the workload is running on.
You can retrieve the hostname using `gcloud` by providing the TPU VM name and
TPU's the zone:
`gcloud compute tpus tpu-vm ssh $TPU_NAME --zone=$ZONE --command="hostname"`
* `ZONE`: This is the zone of the TPU VM. Note that it is ***NOT** necessarily
the same as the `xprofiler` VM instance that is displaying TensorBoard.
* `GCP_PROJECT_NAME`: This is the project name for the TPU VM.
Note that it is ***NOT** necessarily the same as the `xprofiler` VM instance
that is displaying TensorBoard. However, it likely will need to be since
having the TPU in a different project will likely lead to permission issues,
preventing profile capture.
* `PORT_NUMBER`: This is the port that was set when starting the profile server
in the relevant code.
See earlier [prerequisite section](#prerequisite-enable-collector).
For example, your string will look similar to this:
```
t1v-n-g8675e3i-w-0.us-east5-b.c.my-project.internal:9012
```
You can then adjust any of the other settings you care to modify and click
"CAPTURE".
You will see a loading animation and then a message at the bottom of the screen.
If successful, you will see a message similar to this:

If something went wrong you might see something similar to this:

You can attempt the capture again, ensuring your settings in the form are
correct. You may also need to confirm the TPU workload is running and properly
configured for profiling.
> Note:
> After a successful capture, you might need to refresh the dashboard.
> You can hit the refresh icon for a single refresh or go to the settings menu
> (the gear icon) and set "Reload data" automatically.
###### Profile Capture via `xprofiler`: GCE
For JAX, `xprofiler` requires the
[tensorboard-plugin-profile](https://pypi.org/project/tensorboard-plugin-profile)
package and must also be available on target VMs.
> Note: `xprofiler` uses `gsutil` to move files to GCS bucket from target VM.
> VMs must have `gcloud` pre-installed.
```bash
# Trigger capture profile
# Framework can be jax or pytorch
xprofiler capture \
-z \
-l gs:/// \
-f jax \
-n vm_name1 vm_name2 vm_name3 \
-d 2000 # duration in ms
Starting profile capture on host vm_name1.
Profile saved to gs:////tensorboard and session id is session_2025_04_03_18_13_49.
Starting profile capture on host vm_name2.
Profile saved to gs:////tensorboard and session id is session_2025_04_03_18_13_49.
```
###### Profile Capture via `xprofiler`: GKE
For GKE, users are required to setup `kubectl` and cluster context on their
machines. (See details on setting up
[kubectl](https://cloud.google.com/kubernetes-engine/docs/how-to/cluster-access-for-kubectl).)
```bash
gcloud container clusters get-credentials --region=
```
After setting up credentials, users can verify the current context:
```bash
kubectl config current-context
gke___
```
Users can then get a mapping between pods and nodes using the `kubectl get pods`
command:
```bash
$ kubectl get pods -o wide| awk '{print $1"\t\t"$7}'
```
For GKE, users can then pass a list of pods to `xprofiler capture` command to
initiate profile capture.
```bash
# Trigger capture profile
# Framework can be jax or pytorch
xprofiler capture \
-z \
-o gke \
-l gs:/// \
-f jax
-n pod_1 pod_2 pod_3 \
-d 2000 # duration in ms
Starting profile capture on pod_1.
Profile saved to gs:////tensorboard and session id is session_2025_04_03_18_13_49.
Starting profile capture on pod_2.
Profile saved to gs:////tensorboard and session id is session_2025_04_03_18_13_49.
```
## Details on `xprofiler`
### Main Command: `xprofiler`
The `xprofiler` command has additional subcommands that can be invoked to
[create](#subcommand-xprofiler-create) VM instances,
[list](#subcommand-xprofiler-list) VM instances,
[delete](#subcommand-xprofiler-delete) instances, etc.
However, the main `xprofiler` command has some additional options without
invoking a subcommand.
#### `xprofiler --help`
Gives additional information about using the command including flag options and
available subcommands. Also can be called with `xprofiler -h`.
> Note: Each subcommand has a `-h (--help)` flag that can give information
about that specific subcommand. For example: `xprofiler list -h`
### Passing Extra Arguments to `xprofiler` Subcommands
Each available subcommand has a set of parameters passed in with various flags.
These flags enable certain actions including forming the internal commands
(mostly [`gcloud`](https://cloud.google.com/cli) commands).
However, some advanced users might find it useful to override the internal
commands' flags and/or find the available subcommand flags limiting. In that
case, those users may find the feature of being able to pass extra arguments
(not officially defined in the `xprofiler` subcommand) to xprofiler subcommands
useful.
The basic use is to give flags to the internal command. This means the user
should ideally be fairly familiar with how the subcommand being overridden would
use these commands. Thus this is considered a ***advanced usage*** and should be
used with ***caution***.
Below is an example of using extra arguments to change the
[maintence policy](https://cloud.google.com/sdk/gcloud/reference/compute/instances/create#--maintenance-policy)
for the `xprofiler` VM instance using the `create` subcommand:
```bash
xprofiler \
create \
-z us-east5-a -l gs://example-gs-bucket/path \
--maintenance-policy=terminate
```
This will essentially add the flag `--maintenance-policy=terminate` to the main
internal `gcloud` command within the `create` subcommand.
The following extra argument formats are supported:
* `--flag` or `-f` (as a boolean flag)
* `--flag value` or `-f value`
* `--flag=value` or `-f=value`
* `--flag=value0,value1,value2` or `-f value0,value1,value2` for multiple values
* `--flag value0,value1,value2` or `-f value0,value1,value2` for multiple values
> Note:
> It's recommended that users pass extra arguments *after* the subcommand
> (`create`, `list`, etc.).
>
> Although there is some support providing the extra arguments before the
> subcommand (such as `xprofiler --limit=5 list -z $ZONE`) it is not guaranteed
> to work. This is because there can be interference with the subcommand
> position.
Values given as extra arguments may override the values used in the original
main internal command.
For example, consider the following command:
```bash
xprofiler \
create \
-z us-east5-a -l gs://example-gs-bucket/path \
--zone=us-central1-a
```
This will effectively execute the same main internal command as if this was run
instead:
```bash
xprofiler create -z us-central1-a -l gs://example-gs-bucket/path
```
Finally, it should be noted that multiple values can be used as extra arguments,
such as the example below:
```bash
xprofiler \
create \
-z us-east5-a -l gs://example-gs-bucket/path \
--zone=us-central1-a \
--maintenance-policy=terminate \
--machine-type=e2-highmem-8
```
### Subcommand: `xprofiler create`
This command is used to create a new VM instance for `xprofiler` to run with a
given profile log directory GCS path.
`xprofiler create` will return an error if the machine type given is not found
in the provided zone. Note that the error message will include a `gcloud`
command that can be used to determine a zone with the given machine type.
Usage details:
```
xprofiler create
[--help]
--log-directory GS_PATH
--zone ZONE_NAME
[--vm-name VM_NAME]
[--machine-type MACHINE_TYPE]
[--auto-delete-on-failure-off]
[--verbose]
```
#### `xprofiler create --help`
This provides the basic usage guide for the `xprofiler create` subcommand.
#### `xprofiler create --machine-type`
The `create` command defaults to using `c4-highmem-8` for the VM instance.
However, users can specify a different machine type using the flag
`--machine-type` followed by a machine type such as `e2-highmem-8`. Information
on machine types can be found
[here](https://cloud.google.com/compute/docs/machine-resource). Also see
our [recommendations for `xprofiler`](#machine-types)
Note that if a machine type is not found for the given zone, an error will occur
with a suggestion for running a `gcloud` command as well as some available zones
for that machine type.
The output will look similar to this:
```bash
Please check the machine type w/ us-east5-c and try again. You can investigate zones with the machine type victors-discount-vm available:
gcloud compute machine-types list --filter="name=victors-discount-vm" --format="value(zone)"
The machine type and zone do not match.
Suggested zones with machine type victors-discount-vm available:
['us-central1-a', 'us-central1-b', 'us-central1-c', 'us-central1-f', 'europe-west1-b', 'europe-west1-c', 'europe-west1-d', 'us-west1-a', 'us-west1-b', 'us-west1-c']
```
#### `xprofiler create --auto-delete-on-failure-off`
The `create` command will automatically delete failed VM instances created by
the `xprofiler` tool. This is to ensure that a malformed VM does not persist if
it can't be fully utilized by `xprofiler`.
However, it can optionally turn off automatic deletion using the
`--auto-delete-on-failure-off` flag. This can be particularly useful in
debugging issues when creating VMs.
### Subcommand: `xprofiler list`
This command is used to list a VM instances created by the `xprofiler` tool.
Usage details:
```
xprofiler list
[--help]
[--zones ZONE_NAME [ZONE_NAME ...]]
[--log-directory GS_PATH [GS_PATH ...]]
[--vm-name VM_NAME [VM_NAME ...]]
[--filter FILTER_NAME [FILTER_NAME ...]]
[--verbose]
```
#### `xprofiler list --help`
This provides the basic usage guide for the `xprofiler list` subcommand.
#### `xprofiler list --zones`
The `list` subcommand can optionally take a `-z (--zones)` flag to specify which
zones to consider for listing VMs.
```bash
# Listing all xprofiler VMs in us-central1-a
xprofiler list -z us-central1-a
# Listing all xprofiler VMs in us-east5-a and us-central1-a
xprofiler list -z us-east5-a us-central1-a
```
If no value for the zones is provided, then `xprofiler list` will search across
all zones with any other matching criteria in mind. This however, can
potentially take significantly more time so it is recommended to specify the
zone(s) explicitly.
#### Optionally specifying log directories and/or VM names
Users optionally can specify one or more log directories (GCS paths) and/or VM
names. This can be done with the `-l (--log-directory)` flag for log directories
and with the `-n (--vm-name)` flag for VM instance names.
When specifying multiple criteria, any matching VM will be listed.
Examples:
```bash
# List VMs that match either GCS path
xprofiler list -l gs://bucket0/top-dir gs://bucket1/top-dir
# List VMs that match either VM name
xprofiler list -n my-vm-one my-vm-two
# List VMs that match any of the GCS paths or VM names
xprofiler list \
-l gs://bucket0/top-dir gs://bucket1/top-dir \
-n my-vm-one my-vm-two
```
### Subcommand: `xprofiler delete`
This command is used to delete VM instances, focused on those created by the
`xprofiler` tool.
Usage details:
```
xprofiler delete
[--help]
--zone ZONE_NAME
[--log-directory GS_PATH [GS_PATH ...]]
[--vm-name VM_NAME [VM_NAME ...]]
[--verbose]
```
#### `xprofiler delete --help`
This provides the basic usage guide for the `xprofiler delete` subcommand.
### Subcommand: `xprofiler capture`
This command is used to capture profiles from a running workload. The captured
profiles will be saved based on the `--log-directory` path.
Specifically `gs:////plugins/profile/` if given
`gs:///` for the log directory.
Usage details:
```
xprofiler capture
[--help]
--log-directory GS_PATH
--zone ZONE_NAME
--hosts HOST_NAME [HOST_NAME ...]
--framework FRAMEWORK
[--orchestrator ORCHESTRATOR]
[--duration DURATION]
[--port LOCAL_PORT]
[--verbose]
```
#### `xprofiler capture --help`
This provides the basic usage guide for the `xprofiler capture` subcommand.
#### `xprofiler connect --help`
```
xprofiler connect
[--help]
--log-directory GS_PATH
--zone ZONE_NAME
[--mode MODE]
[--port LOCAL_PORT]
[--host-port HOST_PORT]
[--disconnect]
[--verbose]
```
#### `xprofiler connect --help`
This provides the basic usage guide for the `xprofiler connect` subcommand.