https://github.com/ait-aecid/kyoushi-environment
Scripts to deploy virtual testbed for log data analysis and anomaly detection.
https://github.com/ait-aecid/kyoushi-environment
anomaly-detection cyber-attacks data-mining hids ids kyoushi log-data logs monitoring nids security simulation
Last synced: 6 months ago
JSON representation
Scripts to deploy virtual testbed for log data analysis and anomaly detection.
- Host: GitHub
- URL: https://github.com/ait-aecid/kyoushi-environment
- Owner: ait-aecid
- License: gpl-3.0
- Created: 2021-12-16T10:54:24.000Z (over 4 years ago)
- Default Branch: main
- Last Pushed: 2023-11-21T15:04:40.000Z (over 2 years ago)
- Last Synced: 2025-04-07T20:54:25.114Z (over 1 year ago)
- Topics: anomaly-detection, cyber-attacks, data-mining, hids, ids, kyoushi, log-data, logs, monitoring, nids, security, simulation
- Language: Jinja
- Homepage:
- Size: 8.35 MB
- Stars: 23
- Watchers: 4
- Forks: 5
- Open Issues: 5
-
Metadata Files:
- Readme: README.md
- License: LICENSE
Awesome Lists containing this project
README
# Kyoushi Testbed Environment
This tool allows to generate labeled log datasets in simulation testbeds for security evaluations, e.g., IDSs, alert aggregation, or federated learning.

The testbed simulates an enterprise IT network, involving mail servers, file share, firewall, intranet, DMZ, DNS, VPN, etc. Log data is collected from many sources, including network traffic, apache access logs, DNS logs, syslog, authentication logs, audit logs, suricata logs, exim/mail logs, monitoring logs, etc. The Kyoushi testbed was used to generate the following publicly available log datasets:
* [AIT-LDSv1](https://zenodo.org/record/4264796)
* [AIT-LDSv2](https://zenodo.org/record/5789064)
* [Kyoushi LDS](https://zenodo.org/record/5779411)
# Overview
The Kyoushi Testbed comprises a network with three zones: Intranet, DMZ, and Internet. Ubuntu VMs that simulate employees are located in all zones, where remote employees access the Intranet through a VPN connection. Employees utilize the Horde Mail platform, access the WordPress platform, share files, browse the web, and access the servers via SSH, while external users only send and respond to mails. The following figure shows an overview of the network.
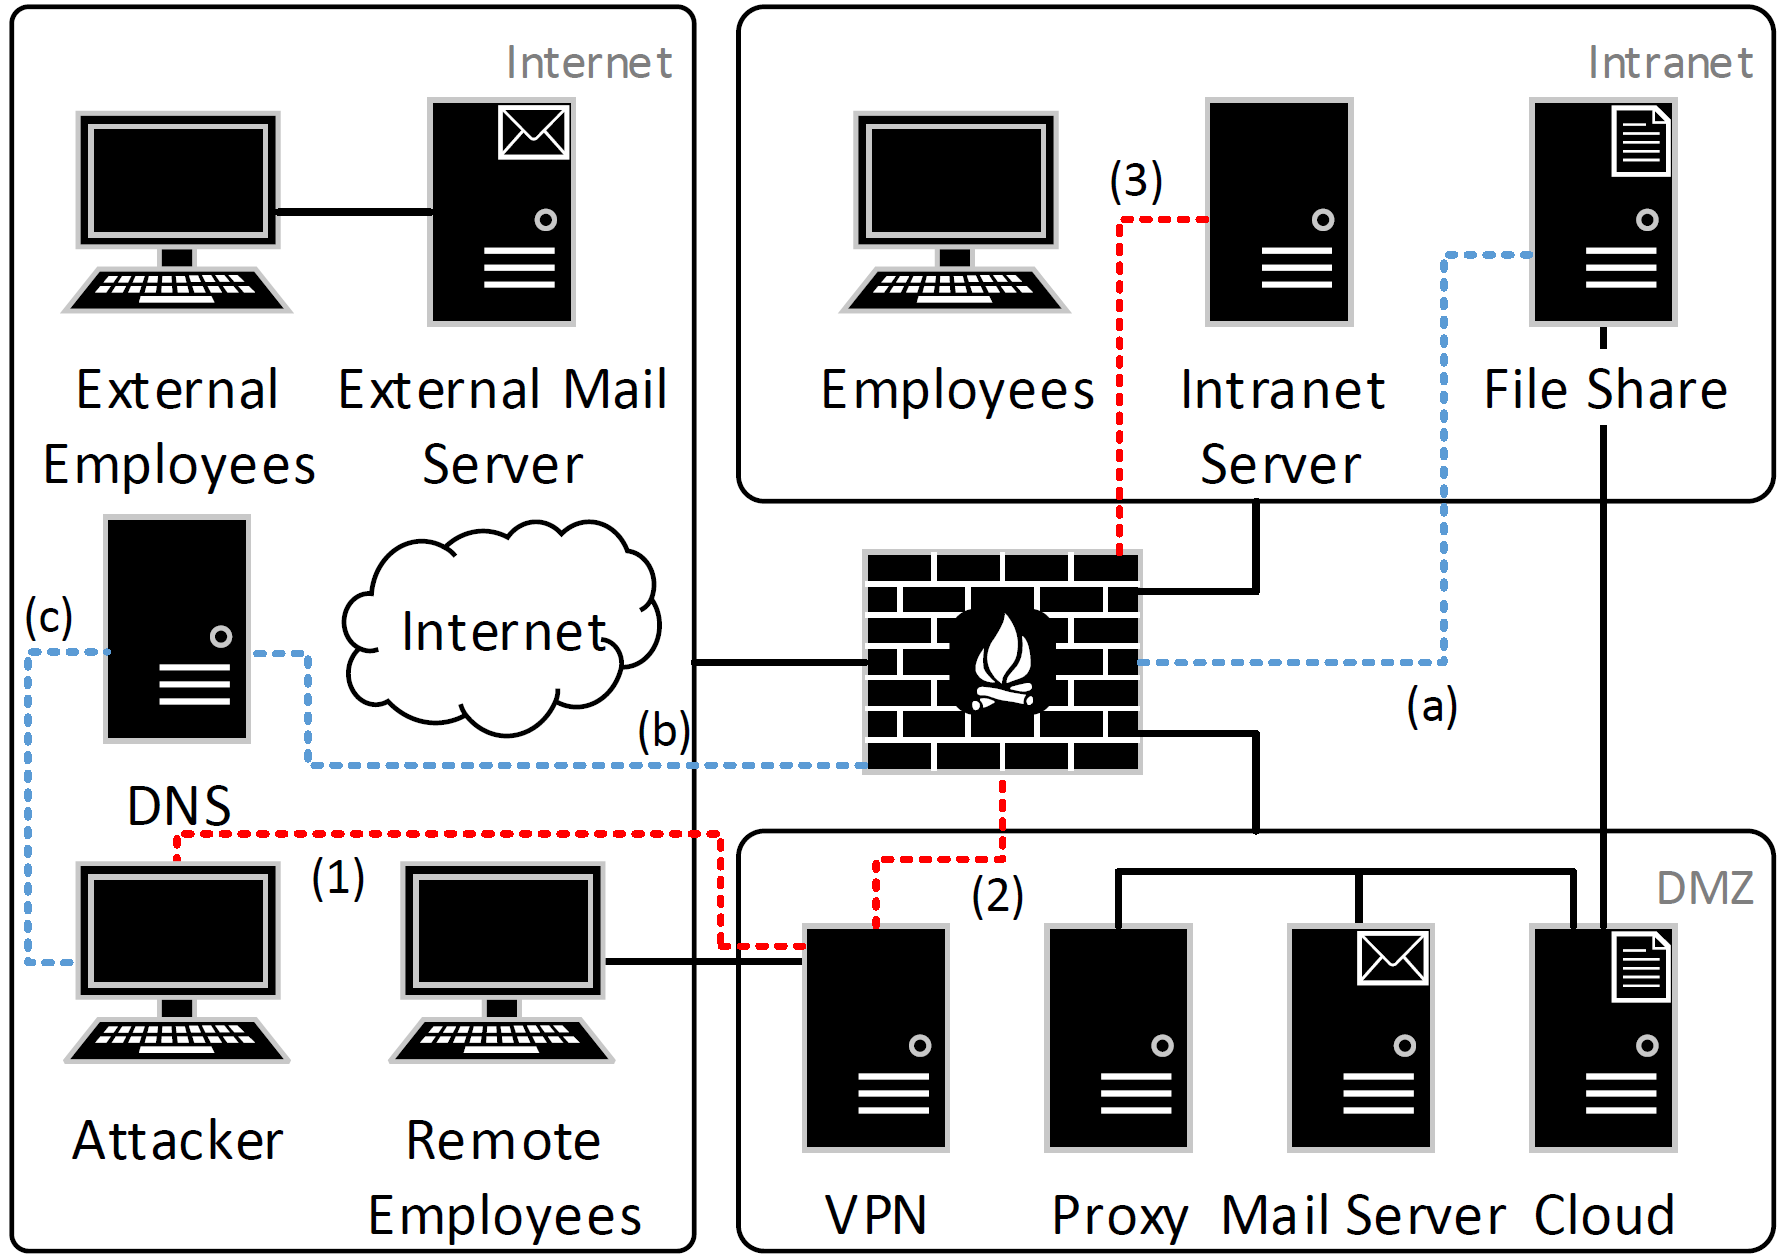
Several attacks are launched against the network from an attacker host. Thereby, the attacker gets access to the infrastructure through stolen VPN credentials. The following attacks are implemented:
* Scans (nmap, WPScan, dirb)
* Webshell upload (CVE-2020-24186)
* Password cracking (John the Ripper)
* Privilege escalation
* Remote command execution
* Data exfiltration (DNSteal)
## Getting Started
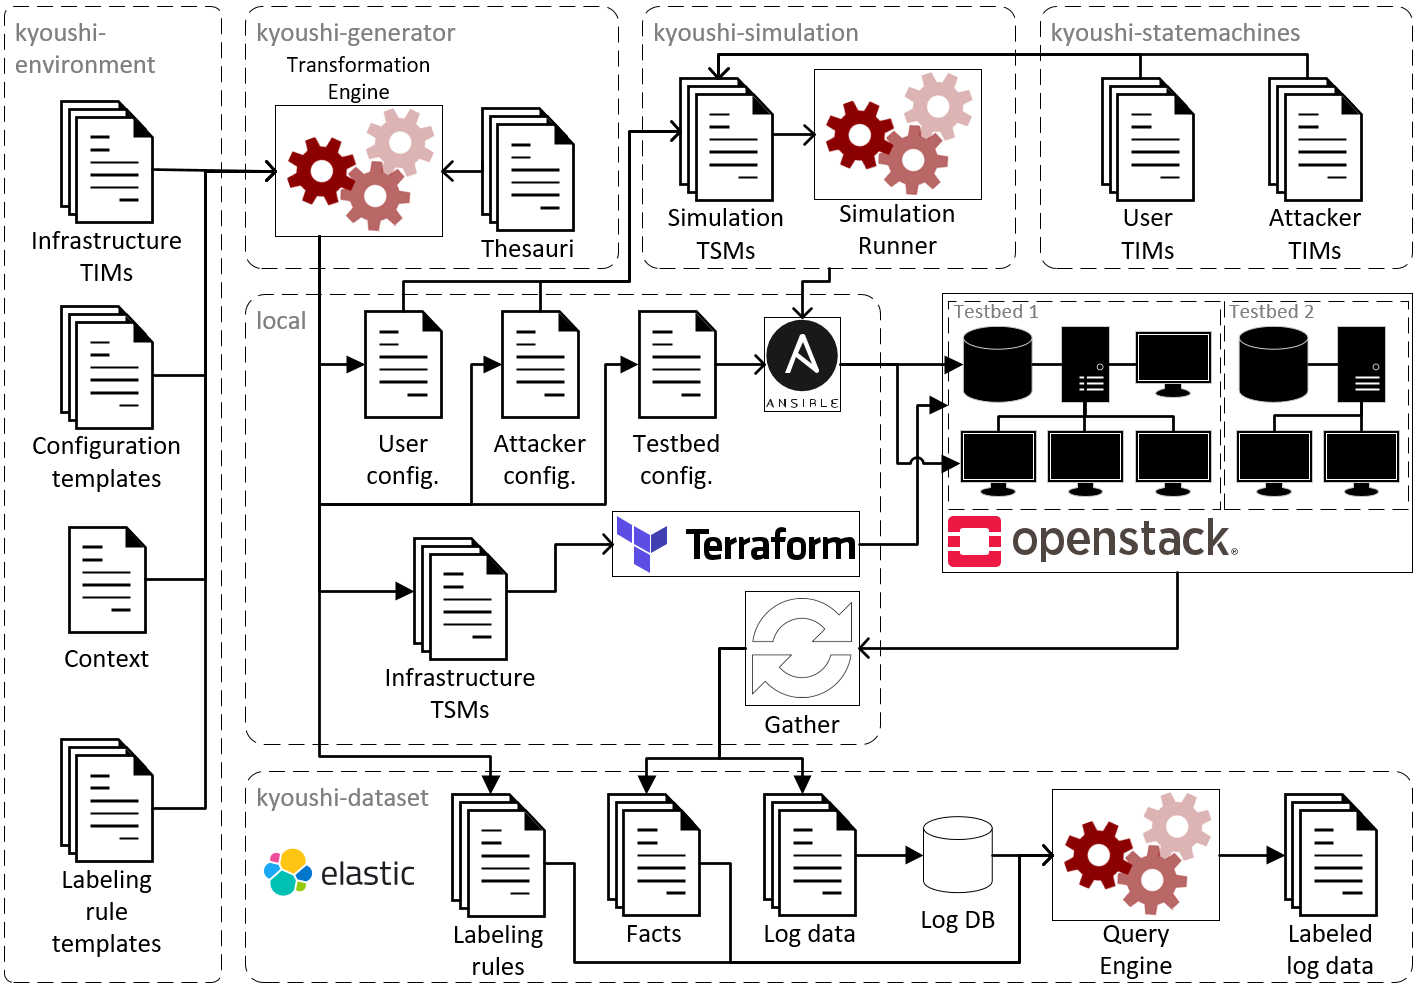
This is the main repository for the Kyoushi Testbed Environment that contains all models of the testbed infrastructure; it relies on several other repositories that are responsible for generating testbeds from the models (kyoushi-generator), running user and attacker simulations (kyoushi-simulation), collecting and labeling log data (kyoushi-dataset), etc. The following figure provides a rough overview of how all involved repositories work together.
The following instructions cover the whole procedure to create a testbed and collect log data from scratch. *Please note*: The Kyoushi Testbed Environment is designed for deployment on cloud infrastructure and will require at least 30 VCPUs, 800 GB of disk space, and 60 GB of RAM. This getting-started relies on OpenStack, Ansible, and Terragrunt, and assumes that the user is experienced with infrastructure/software provisioning. We tested the getting-started in a local OpenStack infrastructure as well as an OVH cloud platform. Note that for OVH deployment, it is necessary to use an account with maximum privileges, deploy the kyoushi environment on a GRA9 project (because GRA9 has some required beta features), and add the project to vracks. In the following we use local installation as default and outline necessary changes for public cloud deployment.
For the instructions stated in this getting-started, we assume that the following packages are installed in the correct versions:
```
Python 3.8.5
Poetry 1.1.7
Terraform v1.1.7
terragrunt version v0.31.3
ansible [core 2.11.5]
packer 1.8.0
```
### Generating a Testbed from the Models
First, switch into a directory named kyoushi and check out the kyoushi-environment (this repository):
```bash
user@ubuntu:~$ mkdir kyoushi
user@ubuntu:~$ cd kyoushi
user@ubuntu:~/kyoushi$ git clone https://github.com/ait-aecid/kyoushi-environment.git
Cloning into 'kyoushi-environment'...
```
The kyoushi-environment contains all models of the testbed infrastructure. These models allow to generate many different testbeds that vary in size and configuration. Testbed parameters that are subject to change include IP addresses of hosts, the number of simulated users, as well as their names and behavior profiles. Most of these parameters are set in the `context.yml.j2` file. Here you can specify the number of users hosts (default: 2 internal, 2 remote, and 2 external users), the number of external mail servers (default: 1), and the times when attacks are carried out. For now, set the `kyoushi_attacker_start` and `dnsteal_endtime` variables to some point in time in the near future, e.g., the following day.
```bash
user@ubuntu:~/kyoushi$ cat /home/user/kyoushi/kyoushi-environment/model/context.yml.j2
{% set employees_internal_count = gen.random.randint(2, 2) %}
{% set employees_remote_count = gen.random.randint(2, 2) %}
{% set ext_mail_users_count = gen.random.randint(2, 2) %}
{% set mail_servers_external_count = gen.random.randint(1, 1) %}
kyoushi_attacker_start: 2021-10-04T{{ (gen.random.randint(9, 14) | string()).zfill(2) }}:{{ (gen.random.randint(0, 59) | string()).zfill(2) }}
kyoushi_attacker_escalate_start: +P00DT{{ (gen.random.randint(3, 4) | string()).zfill(2) }}H{{ (gen.random.randint(0, 59) | string()).zfill(2) }}M
dnsteal_endtime: 2021-10-02T{{ (gen.random.randint(9, 18) | string()).zfill(2) }}:{{ (gen.random.randint(0, 59) | string()).zfill(2) }}
```
The [kyoushi-generator](https://github.com/ait-aecid/kyoushi-generator) transforms the infrastructure models from the kyoushi-environment into setup scripts that are ready for deployment. Clone the kyoushi-generator as follows and install it using poetry:
```bash
user@ubuntu:~/kyoushi$ git clone https://github.com/ait-aecid/kyoushi-generator.git
Cloning into 'kyoushi-generator'...
user@ubuntu:~/kyoushi$ cd kyoushi-generator/
user@ubuntu:~/kyoushi/kyoushi-generator$ poetry install
Creating virtualenv cr-kyoushi-generator-PMpTKTKv-py3.8 in /home/user/.cache/pypoetry/virtualenvs
```
Now you are ready to run the kyoushi-generator. For this, you need to specify the source directory containing the models as well as the destination directory where you want to save the instantiated testbed. Use the following command to save the testbed in the directory called env:
```bash
user@ubuntu:~/kyoushi/kyoushi-generator$ poetry run cr-kyoushi-generator apply /home/user/kyoushi/kyoushi-environment/ /home/user/kyoushi/env
Created TSM in /home/user/kyoushi/env
You can now change to the directory and push TSM to a new GIT repository.
```
But what exactly happened there? Let's have a look at an example to understand the transformation from the testbed-independent models (TIM) to the testbed-specific models (TSM). Have a look at the DNS configuration of our testbed. The configuration file `dns.yml.j2` in the kyoushi-environment is a jinja2 template that does not specify several properties, such as the name of the domain or the number of mail servers. On the other hand, the dns.yml in the newly generated `env` directory contains specific values for all these variables. For example, in the following, the network is named mccoy. Note that these variables are randomly selected and therefore change every time you run the kyoushi-generator.
```bash
user@ubuntu:~/kyoushi/kyoushi-generator$ cat /home/user/kyoushi/kyoushi-environment/provisioning/ansible/group_vars/all/dns.yml.j2
domains:
\var{context.network_name}:
id: \var{context.network_name}
server: inet-dns
domain: \var{context.network_domain}
...
user@ubuntu:~/kyoushi/kyoushi-generator$ cat /home/user/kyoushi/env/provisioning/ansible/group_vars/all/dns.yml
domains:
mccoy:
id: mccoy
server: inet-dns
domain: mccoy.com
...
```
For more information on the kyoushi-generator, check out the [documentation](https://ait-aecid.github.io/kyoushi-generator/).
### Testbed Deployment
From the OpenStack platform where you plan to deploy the testbed you first need to download an RC file that contains all the necessary environment variables. Note that depending on your cloud provider, this step may be different. Save the file locally and source it as follows.
```bash
user@ubuntu:~/kyoushi$ source /home/user/openrc.sh
```
The Kyoushi testbed is designed for deployment with Consul, so make sure that Consul is available in your infrastructure and that your have a Consul HTTP token with write access for the keystore. There are two main settings that need to be done. First, create an environment variable `CONSUL_HTTP_TOKEN` and point it to your Consul. Second, open the file `/home/user/kyoushi/env/provisioning/terragrunt/terragrunt.hcl` and set the `path` and `address` parameters of the Consul configuration to fit your infrastructure. If you use a public cloud infrastructure such as OVH, you will also have to set the environment variable `TF_VAR_parallelism=1`.
Then, create a key pair and add your key in the `terragrunt.hcl` file. You likely also need to update the `path` parameter in that file. Then apply the changes:
```bash
user@ubuntu:~/kyoushi$ cd /home/user/kyoushi/env/provisioning/terragrunt/keys/
user@ubuntu:~/kyoushi/env/provisioning/terragrunt/keys$ terragrunt apply
Initializing modules...
...
Terraform has been successfully initialized!
```
Once this step is completed, check in your cloud provider that the key was actually uploaded. Next, download the Ubuntu image `bionic-server-cloudimg-amd64.img` from the [Ubuntu cloud images repository](https://cloud-images.ubuntu.com/) and upload it to your cloud provider with the name `kyoushi-ubuntu-bionic` and the format `Raw`. Then create the following flavors:
| Name | VCPUs | Disk space | RAM |
| ---- | ----- | ---------- | --- |
| m1.small | 1 | 20 GB | 2 GB |
| aecid.d1.small | 1 | 50 GB | 2 GB |
| m1.medium | 2 | 40 GB | 4 GB |
| m1.xlarge | 8 | 160 GB | 16 GB |
Then go to the bootstrap directory and configure the settings to fit your virtualization provider if necessary, e.g., the router (default: `kyoushi-router`). If you are using a public cloud, you have to make the following changes:
* Comment out `host_ext_address_index` and `floating_ip_pool` in `inputs` in `bootstrap/terragrunt.hcl`
* Add `provider_net_uuid` and set it to the Ext-Net ID from the cloud provider in `inputs` in `bootstrap/terragrunt.hcl`
* Add `access = false` in `inputs.networks.local` in `bootstrap/terragrunt.hcl`
* Add `access = true` in `inputs.networks.dmz` in `bootstrap/terragrunt.hcl`
* Set the source version of module `vmnets` to `git@github.com:ait-cs-IaaS/terraform-openstack-vmnets.git?ref=v1.5.6` in `bootstrap/module/main.tf`
* Comment out `host_ext_address_index` and `ext_dns` in module `vmnets` in `bootstrap/module/main.tf`
* Set `router_create = true` in module `vmnets` in `bootstrap/module/main.tf`
* Set `provider_net_uuid = var.provider_net_uuid` in module `vmnets` in `bootstrap/module/main.tf`
* Add `access = bool` to the variable networks object in `bootstrap/module/variables.tf`
* Add the following variable in `bootstrap/module/variables.tf`
```bash
variable "provider_net_uuid" {
type = string
description = "UUID of the provider net"
}
```
These changes are not necessary when using a local OpenStack platform. Then use terragrunt to deploy the infrastructure as follows.
```bash
user@ubuntu:~/kyoushi/env/provisioning/terragrunt/keys$ cd ../bootstrap/
user@ubuntu:~/kyoushi/env/provisioning/terragrunt/bootstrap$ terragrunt apply
Initializing modules...
```
Now change to the packer directory to create the images for employee hosts and the share. Again, for local cloud instances, no changes are necessary; however, in case that public cloud infrastructures such as OVH are used, it is necessary to carry out the following changes:
* Set `base_image` to `Ubuntu 18.04` in `employee_image/default.json` and `share_image/default.json` or use any other appropriate image name that is available in the cloud infrastructure
* Set `network` to the Ext-Net ID where the floating IP pool is provided in `employee_image/default.json` and `share_image/default.json`
* Comment out `floating_ip_network` in `employee_image/source.pkr.hcl` and `share_image/source.pkr.hcl`
Then you are ready to generate the image for the employee hosts. For this, install the required packages and then run packer as shown in the following.
```bash
user@ubuntu:~/kyoushi/env/provisioning/terragrunt/bootstrap$ cd ../../packer/employee_image/playbook/
user@ubuntu:~/kyoushi/env/provisioning/packer/employee_image/playbook$ ansible-galaxy install -r requirements.yaml
...
user@ubuntu:~/kyoushi/env/provisioning/packer/employee_image/playbook$ cd ..
user@ubuntu:~/kyoushi/env/provisioning/packer/employee_image$ packer build -var-file=default.json .
...
error writing '/tmp/whitespace': No space left on device
...
Build 'openstack.builder' finished after 24 minutes 39 seconds.
```
Note that some errors stating `No space left on device` may appear during image generation. These errors do not indicate any problems for successfully generating working images; so just wait until the process stops on its own. Now you also need to repeat these commands for creating the share image:
```bash
user@ubuntu:~/kyoushi/env/provisioning/packer/employee_image$ cd ../share_image/playbook/
user@ubuntu:~/kyoushi/env/provisioning/packer/share_image/playbook$ ansible-galaxy install -r requirements.yaml
user@ubuntu:~/kyoushi/env/provisioning/packer/share_image/playbook$ cd ..
user@ubuntu:~/kyoushi/env/provisioning/packer/share_image$ packer build -var-file=default.json .
```
Once this step is complete, make sure that the images are successfully uploaded and available in the cloud infrastructure. Just as before, some changes are necessary in case that a public cloud infrastructure is used:
* Commend out `host_address_index` in `hosts/module/01-management.tf`
* Comment out the output `mgmthost_floating_ip` in `hosts/module/outputs.tf`
* Set `floating_ip_pool = "Ext-Net"` in `hosts/terragrunt.hcl`
* Set `image` to `Ubuntu 18.04` and set `mail_image` and `ext_mail_image` to `Debian 9` in `hosts/terragrunt.hcl` or use any other appropriate image names that are available in the cloud infrastructure
* Set `employee_image` and `ext_user_image` to the name of the employee image and set `share_image` to the name of the share image that were generated using packer in the previous step, in `hosts/terragrunt.hcl`
While these changes are not necessary on local cloud instances, you still need to make sure that the `terragrunt.hcl` file of the hosts directory fits your infrastructure. Then, apply the changes:
```bash
user@ubuntu:~/kyoushi/env/provisioning/packer/share_image$ cd ../../terragrunt/hosts/
user@ubuntu:~/kyoushi/env/provisioning/terragrunt/hosts$ terragrunt apply
Initializing modules...
```
Once all virtual machines are up and running, you are ready to setup all services. For this, you need to install all requirements in the requirements.txt and requirements.yml file.
```bash
user@ubuntu:~/kyoushi/env/provisioning/terragrunt$ cd ../ansible/
user@ubuntu:~/kyoushi/env/provisioning/ansible$ source activate
user@ubuntu:~/kyoushi/env/provisioning/ansible$ pip3 install -r requirements.txt
user@ubuntu:~/kyoushi/env/provisioning/ansible$ ansible-galaxy install -r requirements.yml
Starting galaxy role install process
...
```
After installing all requirements, you can run all playbooks that are required for the testbed. The script run_all.sh installs all playbooks one after another, so you can just run the script. In case that one of the playbooks fails, the script will be interrupted. After fixing the error, you may also comment out all playbooks that have successfully been installed to save time. In total, running all playbooks may take several hours.
```bash
user@ubuntu:~/kyoushi/env/provisioning/ansible$ chmod +x run_all.sh
user@ubuntu:~/kyoushi/env/provisioning/ansible$ ./run_all.sh
PLAY [Fact gathering pre dns server configuration]
TASK [Gathering Facts]
ok: [ext_user_1]
...
```
### Starting the Simulation
After all virtual machines are successfully deployed and configured, the simulation is ready to be started. First, start the employee simulations that carry out normal (benign) activities such as sending mails or sharing files. Run the following playbook to start simulations for internal employees (Intranet zone), remote employees (connect through VPN), and external users (Internet zone).
```bash
user@ubuntu:~/kyoushi/env/provisioning/ansible$ ansible-playbook playbooks/run/simulation/main.yml
PLAY [Start employee simulations] **************************************************************************************
TASK [Clean SM log] ****************************************************************************************************
skipping: [internal_employee_1]
...
```
To verify that the simulations successfully launched, it is recommended to log into one of the user machines and check the status of the simulation. To access any machine in the testbed, it is necessary to use the management host (mgmthost) as a proxy, e.g., `ssh -J ait@ ait@`. Note that the user `ait` is available on all machines. The user simulation runs as a service; its current status can be retrived with the command `service ait.beta_user status`. However, it may be more interesting to actually see what the user is currently doing. For this, check out the `sm.log` as shown in the following; the simulation log file generates new lines when new states are reached or actions are executed.
```bash
ait@internal-employee-1:~$ sudo -i
root@internal-employee-1:~# tail /var/log/kyoushi/ait.beta_user/sm.log
{"current_state": "selecting_activity", "level": "info", "message": "Opened horde", "run": "e38ce588-4a7f-409d-b419-e30ede64bf79", "target": "horde_login_check", "timestamp": 1646304147.4995081, "transition": "horde_go_to_horde", "transition_id": "38b772e5-24d6-44e1-83ee-8d052deee5ef"}
{"current_state": "selecting_activity", "level": "info", "message": "Moved to new state", "new_state": "horde_login_check", "run": "e38ce588-4a7f-409d-b419-e30ede64bf79", "target": "horde_login_check", "timestamp": 1646304147.5001175, "transition": "horde_go_to_horde", "transition_id": "38b772e5-24d6-44e1-83ee-8d052deee5ef"}
{"current_state": "horde_login_check", "level": "info", "message": "Executing transition horde_login_check -> name='horde_logged_in_no' -> target=horde_login_page", "run": "e38ce588-4a7f-409d-b419-e30ede64bf79", "target": "horde_login_page", "timestamp": 1646304147.5199068, "transition": "horde_logged_in_no", "transition_id": "fbdf9abb-d56b-4b7c-8e5a-5700dc1110ed"}
{"current_state": "horde_login_check", "level": "info", "message": "Moved to new state", "new_state": "horde_login_page", "run": "e38ce588-4a7f-409d-b419-e30ede64bf79", "target": "horde_login_page", "timestamp": 1646304147.5202732, "transition": "horde_logged_in_no", "transition_id": "fbdf9abb-d56b-4b7c-8e5a-5700dc1110ed"}
{"current_state": "horde_login_page", "level": "info", "message": "Executing transition horde_login_page -> name='horde_login' -> target=horde_selecting_menu", "run": "e38ce588-4a7f-409d-b419-e30ede64bf79", "target": "horde_selecting_menu", "timestamp": 1646304147.5212908, "transition": "horde_login", "transition_id": "9ff90793-ff61-4597-a517-aa33578eb0ee"}
{"current_state": "horde_login_page", "level": "info", "message": "Trying valid login", "password": "X0xVbHXfwZta", "run": "e38ce588-4a7f-409d-b419-e30ede64bf79", "target": "horde_selecting_menu", "timestamp": 1646304153.3251817, "transition": "horde_login", "transition_id": "9ff90793-ff61-4597-a517-aa33578eb0ee", "username": "renee.barnes"}
{"current_state": "horde_login_page", "level": "info", "message": "Logged in", "password": "X0xVbHXfwZta", "run": "e38ce588-4a7f-409d-b419-e30ede64bf79", "target": "horde_selecting_menu", "timestamp": 1646304154.4820826, "transition": "horde_login", "transition_id": "9ff90793-ff61-4597-a517-aa33578eb0ee", "username": "renee.barnes"}
{"current_state": "horde_login_page", "level": "info", "message": "Moved to new state", "new_state": "horde_selecting_menu", "run": "e38ce588-4a7f-409d-b419-e30ede64bf79", "target": "horde_selecting_menu", "timestamp": 1646304177.647844, "transition": "horde_login", "transition_id": "9ff90793-ff61-4597-a517-aa33578eb0ee"}
{"current_state": "horde_selecting_menu", "level": "info", "message": "Executing transition horde_selecting_menu -> name='horde_nav_preferences' -> target=horde_preferences_page", "run": "e38ce588-4a7f-409d-b419-e30ede64bf79", "target": "horde_preferences_page", "timestamp": 1646304177.651773, "transition": "horde_nav_preferences", "transition_id": "7b73236c-f4c4-4e1a-bb0b-1c7b311d6d33"}
{"current_state": "horde_selecting_menu", "level": "info", "message": "Navigating to Global Preferences", "run": "e38ce588-4a7f-409d-b419-e30ede64bf79", "target": "horde_preferences_page", "timestamp": 1646304177.685902, "transition": "horde_nav_preferences", "transition_id": "7b73236c-f4c4-4e1a-bb0b-1c7b311d6d33"}
```
Next, it is necessary to start the attacker simulation. Note that the attacker carries out a sequence of attacks, including scans, remote command execution, password cracking, etc. For more information on the attacks, please refer to the publications stated at the bottom of this page. Run the playbook that starts the simulation as follows.
```bash
user@ubuntu:~/kyoushi/env/provisioning/ansible$ ansible-playbook playbooks/run/attacker_takeover/main.yml
PLAY [Start employee simulations] **************************************************************************************
TASK [Clean SM log] ****************************************************************************************************
skipping: [attacker_0]
TASK [Start attacker SM] ***********************************************************************************************
changed: [attacker_0]
PLAY RECAP *************************************************************************************************************
attacker_0 : ok=1 changed=1 unreachable=0 failed=0 skipped=1 rescued=0 ignored=0
```
As for the normal user simulations, the attacker simulation runs as a service. To retrieve its status, use the command `service ait.aecid.attacker.wpdiscuz status`. Again, it is worth checking out the statemachine logs. As seen in the following sample, the attacker state machine will be created but wait until the datetime `kyoushi_attacker_start` that was configured earlier is reached. Only then the attack chain is launched.
```bash
root@attacker-0:~# tail /var/log/kyoushi/ait.aecid.attacker.wpdiscuz/sm.log
{"level": "info", "message": "Created state machine", "run": "e5a66416-8fbf-4773-b4f4-3173b1b6b4ff", "seed": 672088864, "timestamp": 1646296446.5048175}
```
The `run_all.sh` script that configured all servers also launched the data exfiltration attack, which is assumed to be already ongoing from the beginning of the simulation and stops at some point in time (in case that it is not starting, make sure that the endtime is set to a future date). Check out the logs of this attack case to ensure that the exfiltration script is actually transferring the data. The logs should appear similar to the following sample:
```bash
root@attacker-0:~# tail /var/log/dnsteal.log
{"data_length": 180, "event": "Received data", "file": "b'2010_invoices.xlsx'", "level": "info", "timestamp": 1646298257.592706}
{"data": "b'3x6-.2-.s0sYjwCEihbeKKNdbIOdYlZo6A7EeRg3GTklJq5XPo9bAlWYdiD9Dh8tkuMAj-.1vpJnNwUmtnTNZXSPAF7sPBeqN0nvmS9D4Z79cVp7mO3H*ZSxEQYAIPDASkBw-.2010_invoices.xlsx.lt-22.kelly-livingston.com.'", "event": "Received data text on server", "ip": "192.168.87.64", "level": "debug", "port": 53, "timestamp": 1646298257.5934248}
...
```
For more information on the kyoushi-simulation, check out the [documentation](https://ait-aecid.github.io/kyoushi-simulation/).
### Log Data Collection
Once the simulation is completed (i.e., the attacker simulation has successfully carried out all attacks and the service stopped), it is possible to collect all logs from the testbed. Since copying all logs generates a high amount of traffic and thus unnecessarily bloats the size of the resulting log data set, it is recommended to stop suricata before proceeding. This is accomplished with the following command.
```bash
user@ubuntu:~/kyoushi/env/provisioning/ansible$ ansible-playbook playbooks/run/gather/stop_suricata.yml
```
Then, use the following command to copy all logs to your local system. The playbook will additionally copy relevant facts from the servers, e.g., IP addresses and configurations. When running the playbook, it is necessary to enter the name of the output directory. In the following, the name `out` is used.
```bash
user@ubuntu:~/kyoushi/env/provisioning/ansible$ ansible-playbook playbooks/run/gather/main.yml
[WARNING]: Invalid characters were found in group names but not replaced, use -vvvv to see details
Enter the gather directory path: out
PLAY [all,!mgmthost] ***************************************************************************************************
TASK [Gathering Facts] *************************************************************************************************
ok: [internal_employee_1]
...
```
In case that some of the files fail to be transferred, this usually means that these files are not available (e.g., error files that are not created when no errors occur). The `out` folder will contain directories for all hosts. Inside `out//logs` are the collected log data:
```bash
user@ubuntu:~/kyoushi/env/provisioning/ansible$ ls playbooks/run/gather/out/
attacker_0
cloud_share
ext_user_0
ext_user_1
harrisbarnett_mail
inet-dns
inet-firewall
internal_employee_0
internal_employee_1
internal_share
intranet_server
mail
monitoring
remote_employee_0
remote_employee_1
vpn
webserver
user@ubuntu:~/kyoushi/env/provisioning/ansible$ ls playbooks/run/gather/out/intranet_server/logs/
apache2
audit
auth.log
journal
suricata
syslog
```
Moreover, the script extracted server configurations and facts in `out//configs/` and `out//facts.json`. If you just want to use the log data as is and all you need are the attack times (available in `out/attacker_0/logs/ait.aecid.attacker.wpdiscuz/sm.log`), then you are done at this point. In case that you want to apply labeling rules to mark single events according to their corresponding attack step, continue to the next section.
### Log data Labeling
Labeling of log data is accomplished by processing the data in a pipeline that trims the logs according to the simulation time, parses them with logstash, stores them in an elasticsearch database, and queries the log events corresponding to attacker activities with predefined rules. Accordingly, the machine where labeling takes place should have at least 16 GB RAM and the following dependencies installed:
```
elasticsearch 7.16.2
logstash 7.16.2
TShark (Wireshark) 3.4.8
```
Furthermore, `http.max_content_length: 400mb` needs to be set in `/etc/elasticsearch/elasticsearch.yml`.
The main repository for log data labeling is the [kyoushi-dataset](https://github.com/ait-aecid/kyoushi-dataset). Clone and install the repository as follows.
```bash
user@ubuntu:~/kyoushi$ git clone https://github.com/ait-aecid/kyoushi-dataset.git
Cloning into 'kyoushi-dataset'...
user@ubuntu:~/kyoushi$ cd kyoushi-dataset/
user@ubuntu:~/kyoushi/kyoushi-dataset$ poetry install
Creating virtualenv kyoushi-dataset-L9Pkzr_M-py3.8 in /home/user/.cache/pypoetry/virtualenvs
(kyoushi-dataset-L9Pkzr_M-py3.8) user@ubuntu:~/kyoushi/kyoushi-dataset$ cd ..
```
Now create a new directory where the log data should be processed. However, do not copy the log data directly from the `out` directory; instead, use the following `prepare` command from the kyoushi-dataset to prepare the logs for further processing. Make sure that `-g` points to the gather directory containing the logs, `-p` points to the processing directory of the kyoushi-environment containing the labeling templates, and the attack execution is within `--start` and `--end` (logs outside of this interval are trimmed).
```bash
(kyoushi-dataset-L9Pkzr_M-py3.8) user@ubuntu:~/kyoushi$ mkdir processed
(kyoushi-dataset-L9Pkzr_M-py3.8) user@ubuntu:~/kyoushi$ cd processed
(kyoushi-dataset-L9Pkzr_M-py3.8) user@ubuntu:~/kyoushi/processed$ cr-kyoushi-dataset prepare -g /home/user/kyoushi/env/provisioning/ansible/playbooks/run/gather/out -p /home/user/kyoushi/kyoushi-environment/datasets/scenario/processing/ --start 2022-03-03T00:00:00 --end 2022-03-04T00:00:00 --name processed
Creating dataset directory structure ...
Creating dataset config file ..
Copying gathered logs and facts into the dataset ...
Copying the processing configuration into the dataset ...
Dataset initialized in: /home/user/kyoushi/processed
```
Before going to the next step, make sure that the elasticsearch database is empty and no legacy files from previous runs exist (this should not apply when kyoushi-dataset is executed for the first time). If such legacy files exist, the kyoushi-generator will get stuck in the following step without error messages or timeout. Therefore, make sure to run the following commands to clear the database and delete existing sincedb files.
```bash
(kyoushi-dataset-L9Pkzr_M-py3.8) user@ubuntu:~/kyoushi/processed$ curl -XDELETE localhost:9200/_all
(kyoushi-dataset-L9Pkzr_M-py3.8) user@ubuntu:~/kyoushi/processed$ sudo service elasticsearch restart
(kyoushi-dataset-L9Pkzr_M-py3.8) user@ubuntu:~/kyoushi/processed$ rm processing/logstash/data/plugins/inputs/file/.sincedb_*
```
Next, run the `process` command to parse the logs and store them in the elasticsearch database. Depending on the size of your dataset, this step may take several hours. Be aware that several warnings may occur that can be ignored.
```bash
(kyoushi-dataset-L9Pkzr_M-py3.8) user@ubuntu:~/kyoushi/processed$ cr-kyoushi-dataset process
Running pre-processors ...
Executing - Ensure processing config directory exists ...
Executing - Prepare server list ...
Executing - Prepare server facts ...
Executing - Ensure attacker config directory exists ...
Executing - Extract attacker information ...
Executing - Decompress all GZIP logs ...
Executing - Convert attacker pcap to elasticsearch json ...
Executing - Convert attacker pcap to elasticsearch json ...
Executing - Add filebeat index mapping ...
Executing - Add auditbeat index mapping ...
Executing - Add metricsbeat index mapping ...
Executing - Add pcap index mapping ...
Executing - Add openvpn index mapping ...
Executing - Add auditd ingest pipeline to elasticsearch ...
Executing - Setup logstash pipeline ...
Parsing log files ...
```
Once this step is complete, all parsed logs are in the database and can therefore be queried with the elastic query language. In addition, all rules have been rendered from the templates into the `rules` directory. Run the following command to execute the query rules and obtain the labels.
```bash
(kyoushi-dataset-L9Pkzr_M-py3.8) user@ubuntu:~/kyoushi/processed$ cr-kyoushi-dataset label
Applying rule attacker.escalate.sudo.command ...
Rule attacker.escalate.sudo.command applied labels: ['escalated_command', 'escalated_sudo_command', 'escalate'] to 3 lines.
...
Start writing /home/user/kyoushi/processed/gather/intranet_server/logs/auth.log
```
Again, this step may take several hours to complete. Note that this process adds the labels to the log events in the database, i.e., you can see the labels assigned to the events if you query the database manually. Accordingly, no labels are assigned when running the `cr-kyoushi-dataset label` again without first clearing the database and running `cr-kyoushi-dataset process` to avoid that the same label is assigned multiple times to the same event. Once the process is finished, you can find the labels in the `labels` directory. For example, have a look at the labels of the `auth.log` file:
```bash
(kyoushi-dataset-L9Pkzr_M-py3.8) user@ubuntu:~/kyoushi/processed$ cat labels/intranet_server/logs/auth.log
{"line": 145, "labels": ["attacker_change_user", "escalate"], "rules": {"attacker_change_user": ["attacker.escalate.su.login"], "escalate": ["attacker.escalate.su.login"]}}
{"line": 146, "labels": ["attacker_change_user", "escalate", "escalated_command", "escalated_sudo_command"], "rules": {"attacker_change_user": ["attacker.escalate.su.login", "attacker.escalate.systemd.newsession.after"], "escalate": ["attacker.escalate.su.login", "attacker.escalate.systemd.newsession.after", "attacker.escalate.sudo.command"], "escalated_command": ["attacker.escalate.sudo.command"], "escalated_sudo_command": ["attacker.escalate.sudo.command"]}}
{"line": 147, "labels": ["attacker_change_user", "escalate"], "rules": {"attacker_change_user": ["attacker.escalate.su.login"], "escalate": ["attacker.escalate.su.login"]}}
{"line": 148, "labels": ["attacker_change_user", "escalate"], "rules": {"attacker_change_user": ["attacker.escalate.systemd.newsession.after"], "escalate": ["attacker.escalate.systemd.newsession.after"]}}
{"line": 149, "labels": ["escalated_command", "escalated_sudo_command", "escalate"], "rules": {"escalated_command": ["attacker.escalate.sudo.command"], "escalated_sudo_command": ["attacker.escalate.sudo.command"], "escalate": ["attacker.escalate.sudo.command"]}}
{"line": 150, "labels": ["escalated_command", "escalated_sudo_command", "escalate", "escalated_sudo_session"], "rules": {"escalated_command": ["attacker.escalate.sudo.command", "attacker.escalate.sudo.open"], "escalated_sudo_command": ["attacker.escalate.sudo.command", "attacker.escalate.sudo.open"], "escalate": ["attacker.escalate.sudo.command", "attacker.escalate.sudo.open"], "escalated_sudo_session": ["attacker.escalate.sudo.open"]}}
{"line": 151, "labels": ["escalated_command", "escalated_sudo_command", "escalated_sudo_session", "escalate"], "rules": {"escalated_command": ["attacker.escalate.sudo.open"], "escalated_sudo_command": ["attacker.escalate.sudo.open"], "escalated_sudo_session": ["attacker.escalate.sudo.open"], "escalate": ["attacker.escalate.sudo.open"]}}
{"line": 152, "labels": ["escalated_command", "escalated_sudo_command", "escalated_sudo_session", "escalate"], "rules": {"escalated_command": ["attacker.escalate.sudo.open"], "escalated_sudo_command": ["attacker.escalate.sudo.open"], "escalated_sudo_session": ["attacker.escalate.sudo.open"], "escalate": ["attacker.escalate.sudo.open"]}}
```
Each line in the label file corresponds to a specific line in the respective log file, which is referenced by the line number in the field `line`. The field `labels` states the list of labels assigned to the file and the field `rules` states the list of rules that matched the line and assigned the labels. For example, consider the following lines of the `auth.log` file that are marked with aforementioned labels:
```bash
(kyoushi-dataset-L9Pkzr_M-py3.8) user@ubuntu:~/kyoushi/processed$ sed -n '145,152p' gather/intranet_server/logs/auth.log
Mar 3 11:37:40 intranet-server su[27950]: Successful su for bguerrero by www-data
Mar 3 11:37:40 intranet-server su[27950]: + /dev/pts/1 www-data:bguerrero
Mar 3 11:37:40 intranet-server su[27950]: pam_unix(su:session): session opened for user bguerrero by (uid=33)
Mar 3 11:37:40 intranet-server systemd-logind[957]: New session c1 of user bguerrero.
Mar 3 11:37:58 intranet-server sudo: bguerrero : TTY=pts/1 ; PWD=/var/www/intranet.williams.mccoy.com/wp-content/uploads/2022/03 ; USER=root ; COMMAND=list
Mar 3 11:38:06 intranet-server sudo: bguerrero : TTY=pts/1 ; PWD=/var/www/intranet.williams.mccoy.com/wp-content/uploads/2022/03 ; USER=root ; COMMAND=/bin/cat /etc/shadow
Mar 3 11:38:06 intranet-server sudo: pam_unix(sudo:session): session opened for user root by (uid=0)
Mar 3 11:38:06 intranet-server sudo: pam_unix(sudo:session): session closed for user root
```
For more information on kyoushi-dataset, check out the [documentation](https://ait-aecid.github.io/kyoushi-dataset/).
## Publications
If you use the Kyoushi Testbed Environment or any of the generated datasets, please cite the following publications:
* Landauer M., Skopik F., Frank M., Hotwagner W., Wurzenberger M., Rauber A. (2023): [Maintainable Log Datasets for Evaluation of Intrusion Detection Systems.](https://ieeexplore.ieee.org/abstract/document/9866880) IEEE Transactions on Dependable and Secure Computing, vol. 20, no. 4, pp. 3466-3482. \[[PDF](https://arxiv.org/pdf/2203.08580.pdf)\]
* Landauer M., Skopik F., Wurzenberger M., Hotwagner W., Rauber A. (2021): [Have It Your Way: Generating Customized Log Data Sets with a Model-driven Simulation Testbed.](https://ieeexplore.ieee.org/document/9262078) IEEE Transactions on Reliability, Vol.70, Issue 1, pp. 402-415. IEEE. \[[PDF](https://www.skopik.at/ait/2020_trel.pdf)\]
* Landauer M., Frank M., Skopik F., Hotwagner W., Wurzenberger M., Rauber A. (2022): [A Framework for Automatic Labeling of Log Datasets from Model-driven Testbeds for HIDS Evaluation.](https://dl.acm.org/doi/abs/10.1145/3510547.3517924) Proceedings of the Workshop on Secure and Trustworthy Cyber-Physical Systems, pp. 77-86. ACM. \[[PDF](https://www.skopik.at/ait/2022_satcps.pdf)\]