https://github.com/akanz1/klib
Easy to use Python library of customized functions for cleaning and analyzing data.
https://github.com/akanz1/klib
data-analysis data-cleaning data-preprocessing data-science data-visualization feature-selection klib python
Last synced: 6 months ago
JSON representation
Easy to use Python library of customized functions for cleaning and analyzing data.
- Host: GitHub
- URL: https://github.com/akanz1/klib
- Owner: akanz1
- License: mit
- Created: 2020-03-25T11:56:48.000Z (over 6 years ago)
- Default Branch: main
- Last Pushed: 2025-11-06T10:58:20.000Z (9 months ago)
- Last Synced: 2025-11-06T12:25:53.747Z (9 months ago)
- Topics: data-analysis, data-cleaning, data-preprocessing, data-science, data-visualization, feature-selection, klib, python
- Language: Python
- Homepage: https://medium.com/p/97191d320f80
- Size: 47.7 MB
- Stars: 520
- Watchers: 3
- Forks: 56
- Open Issues: 4
-
Metadata Files:
- Readme: README.md
- Funding: .github/FUNDING.yml
- License: LICENSE
- Code of conduct: CODE_OF_CONDUCT.md
Awesome Lists containing this project
README
[](https://github.com/akanz1/klib)
[](https://pypi.org/project/klib/)
[](https://github.com/akanz1/klib/commits/main)
[](https://sonarcloud.io/dashboard?id=akanz1_klib)
[](https://scrutinizer-ci.com/g/akanz1/klib/)
[](https://codecov.io/gh/akanz1/klib)
**klib** is a Python library for importing, cleaning, analyzing and preprocessing data. Explanations on key functionalities can be found on [Medium / TowardsDataScience](https://medium.com/@akanz) and in the [examples](examples) section. Additionally, there are great introductions and overviews of the functionality on [PythonBytes](https://pythonbytes.fm/episodes/show/240/this-is-github-your-pilot-speaking) or on [YouTube (Data Professor)](https://www.youtube.com/watch?v=URjJVEeZxxU).
## Installation
Use the package manager [pip](https://pip.pypa.io/en/stable/) to install klib.
[](https://pypi.org/project/klib/)
[](https://pypi.org/project/klib/)
```bash
pip install -U klib
```
Alternatively, to install this package with conda run:
[](https://anaconda.org/conda-forge/klib)
[](https://anaconda.org/conda-forge/klib)
```bash
conda install -c conda-forge klib
```
## Usage
```python
import klib
import pandas as pd
df = pd.DataFrame(data)
# klib.describe - functions for visualizing datasets
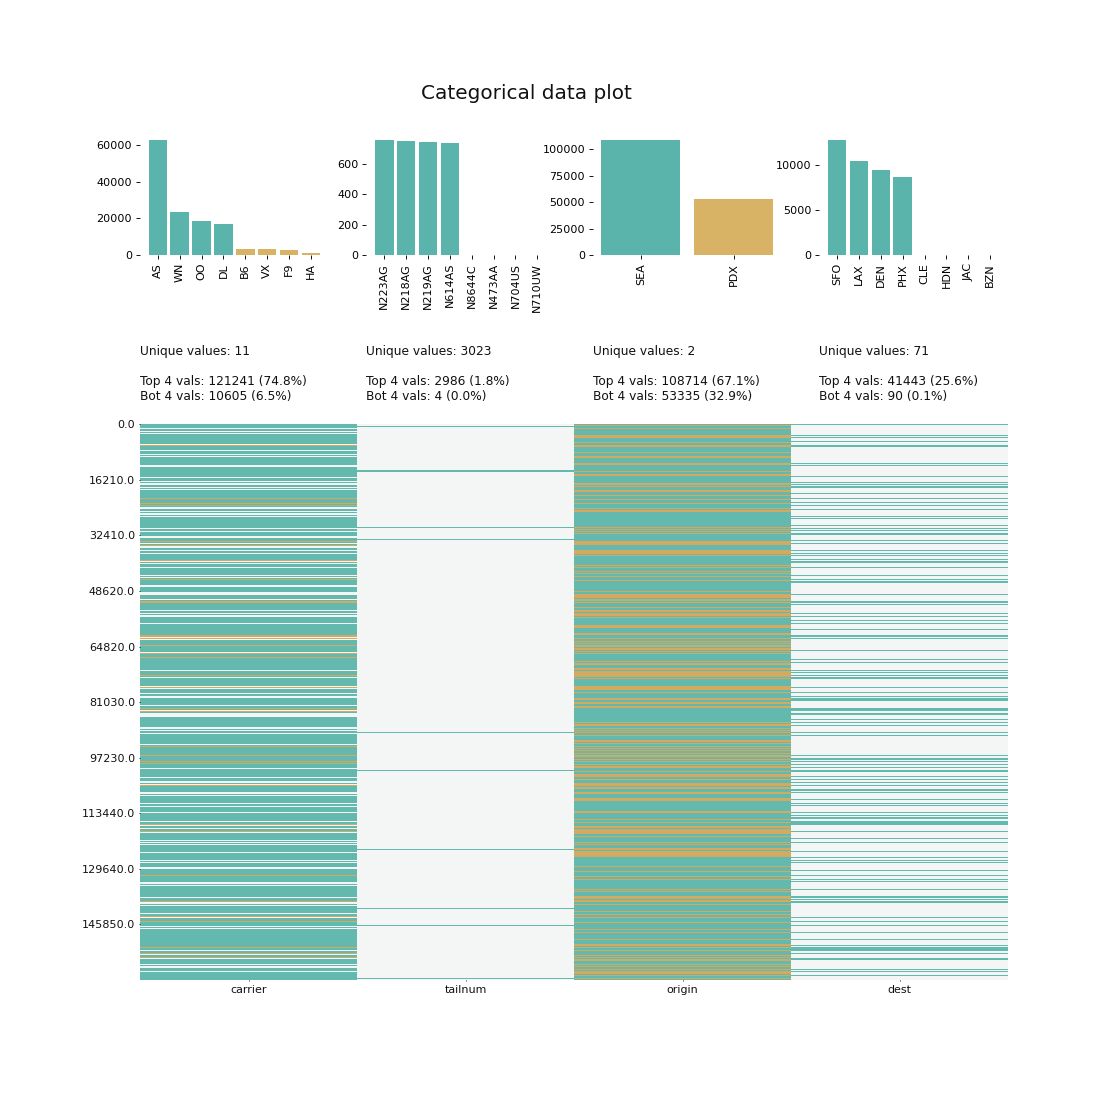
- klib.cat_plot(df) # returns a visualization of the number and frequency of categorical features
- klib.corr_mat(df) # returns a color-encoded correlation matrix
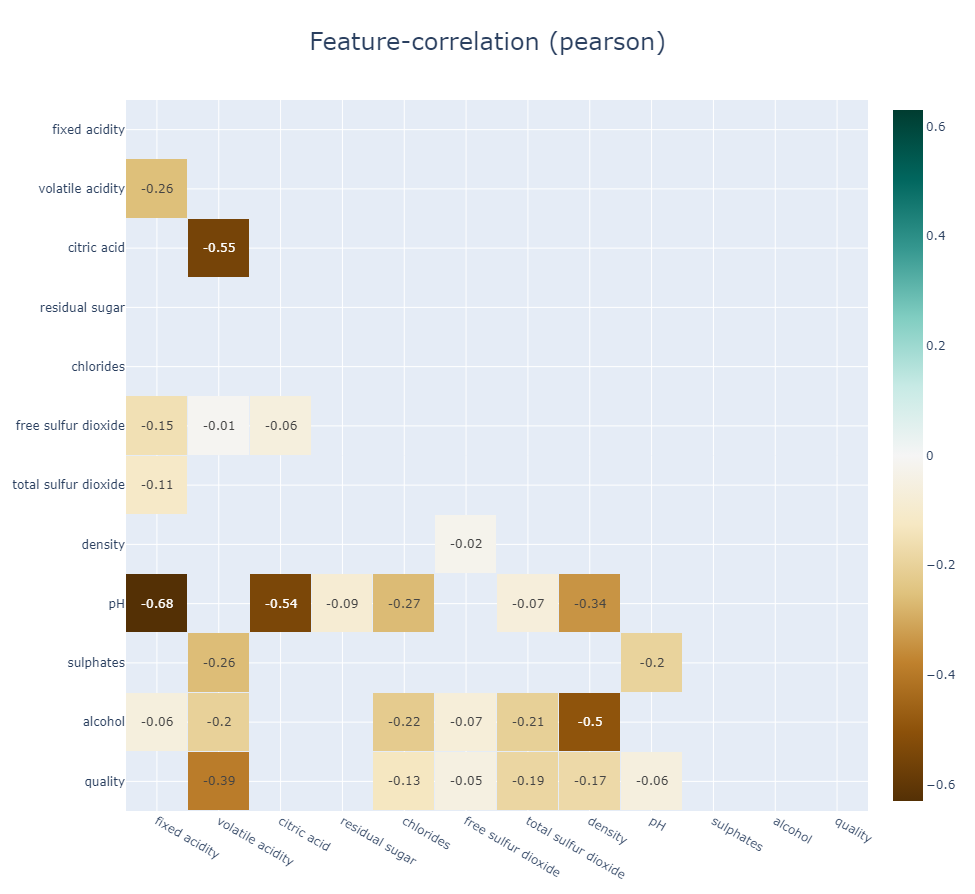
- klib.corr_plot(df) # returns a color-encoded heatmap, ideal for correlations
- klib.corr_interactive_plot(df, split="neg").show() # returns an interactive correlation plot using plotly
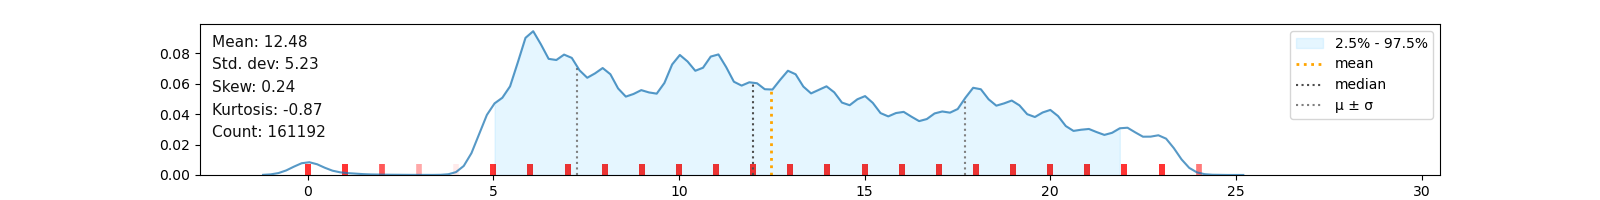
- klib.dist_plot(df) # returns a distribution plot for every numeric feature
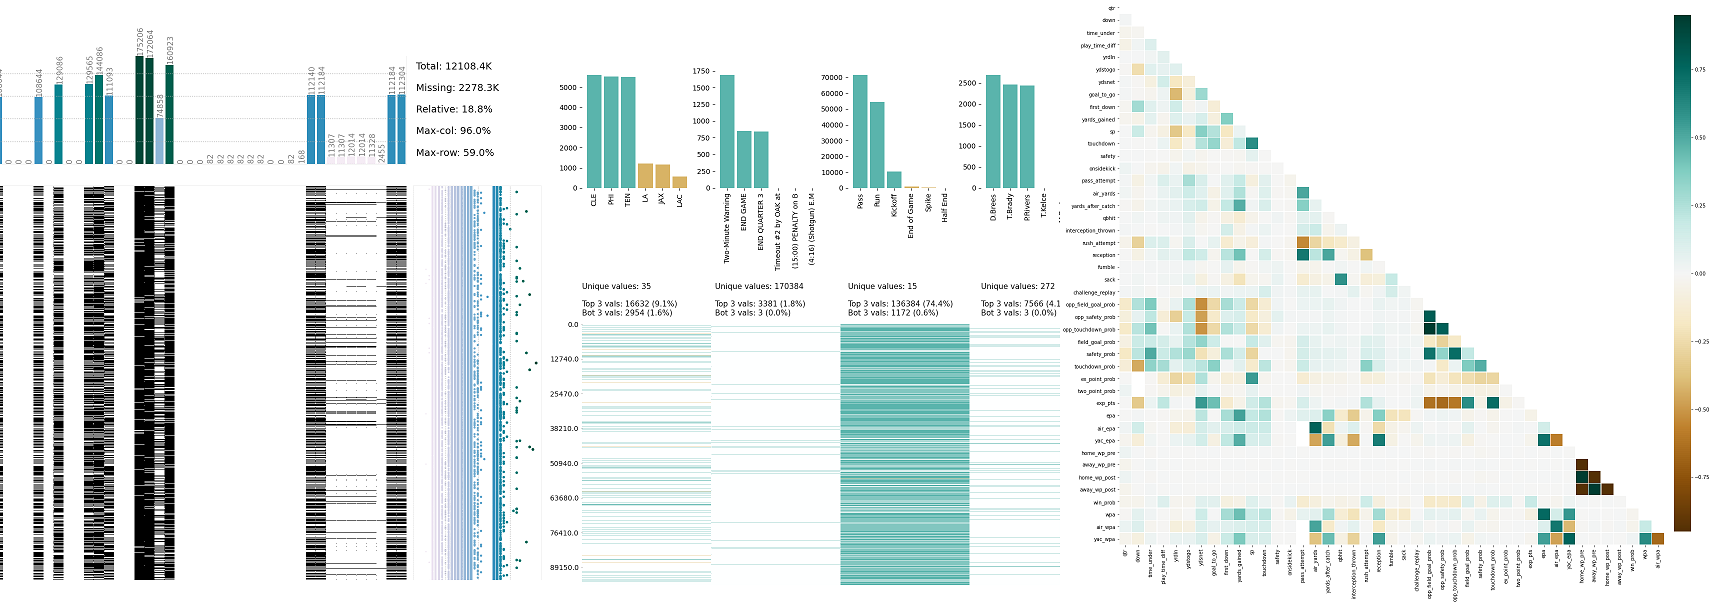
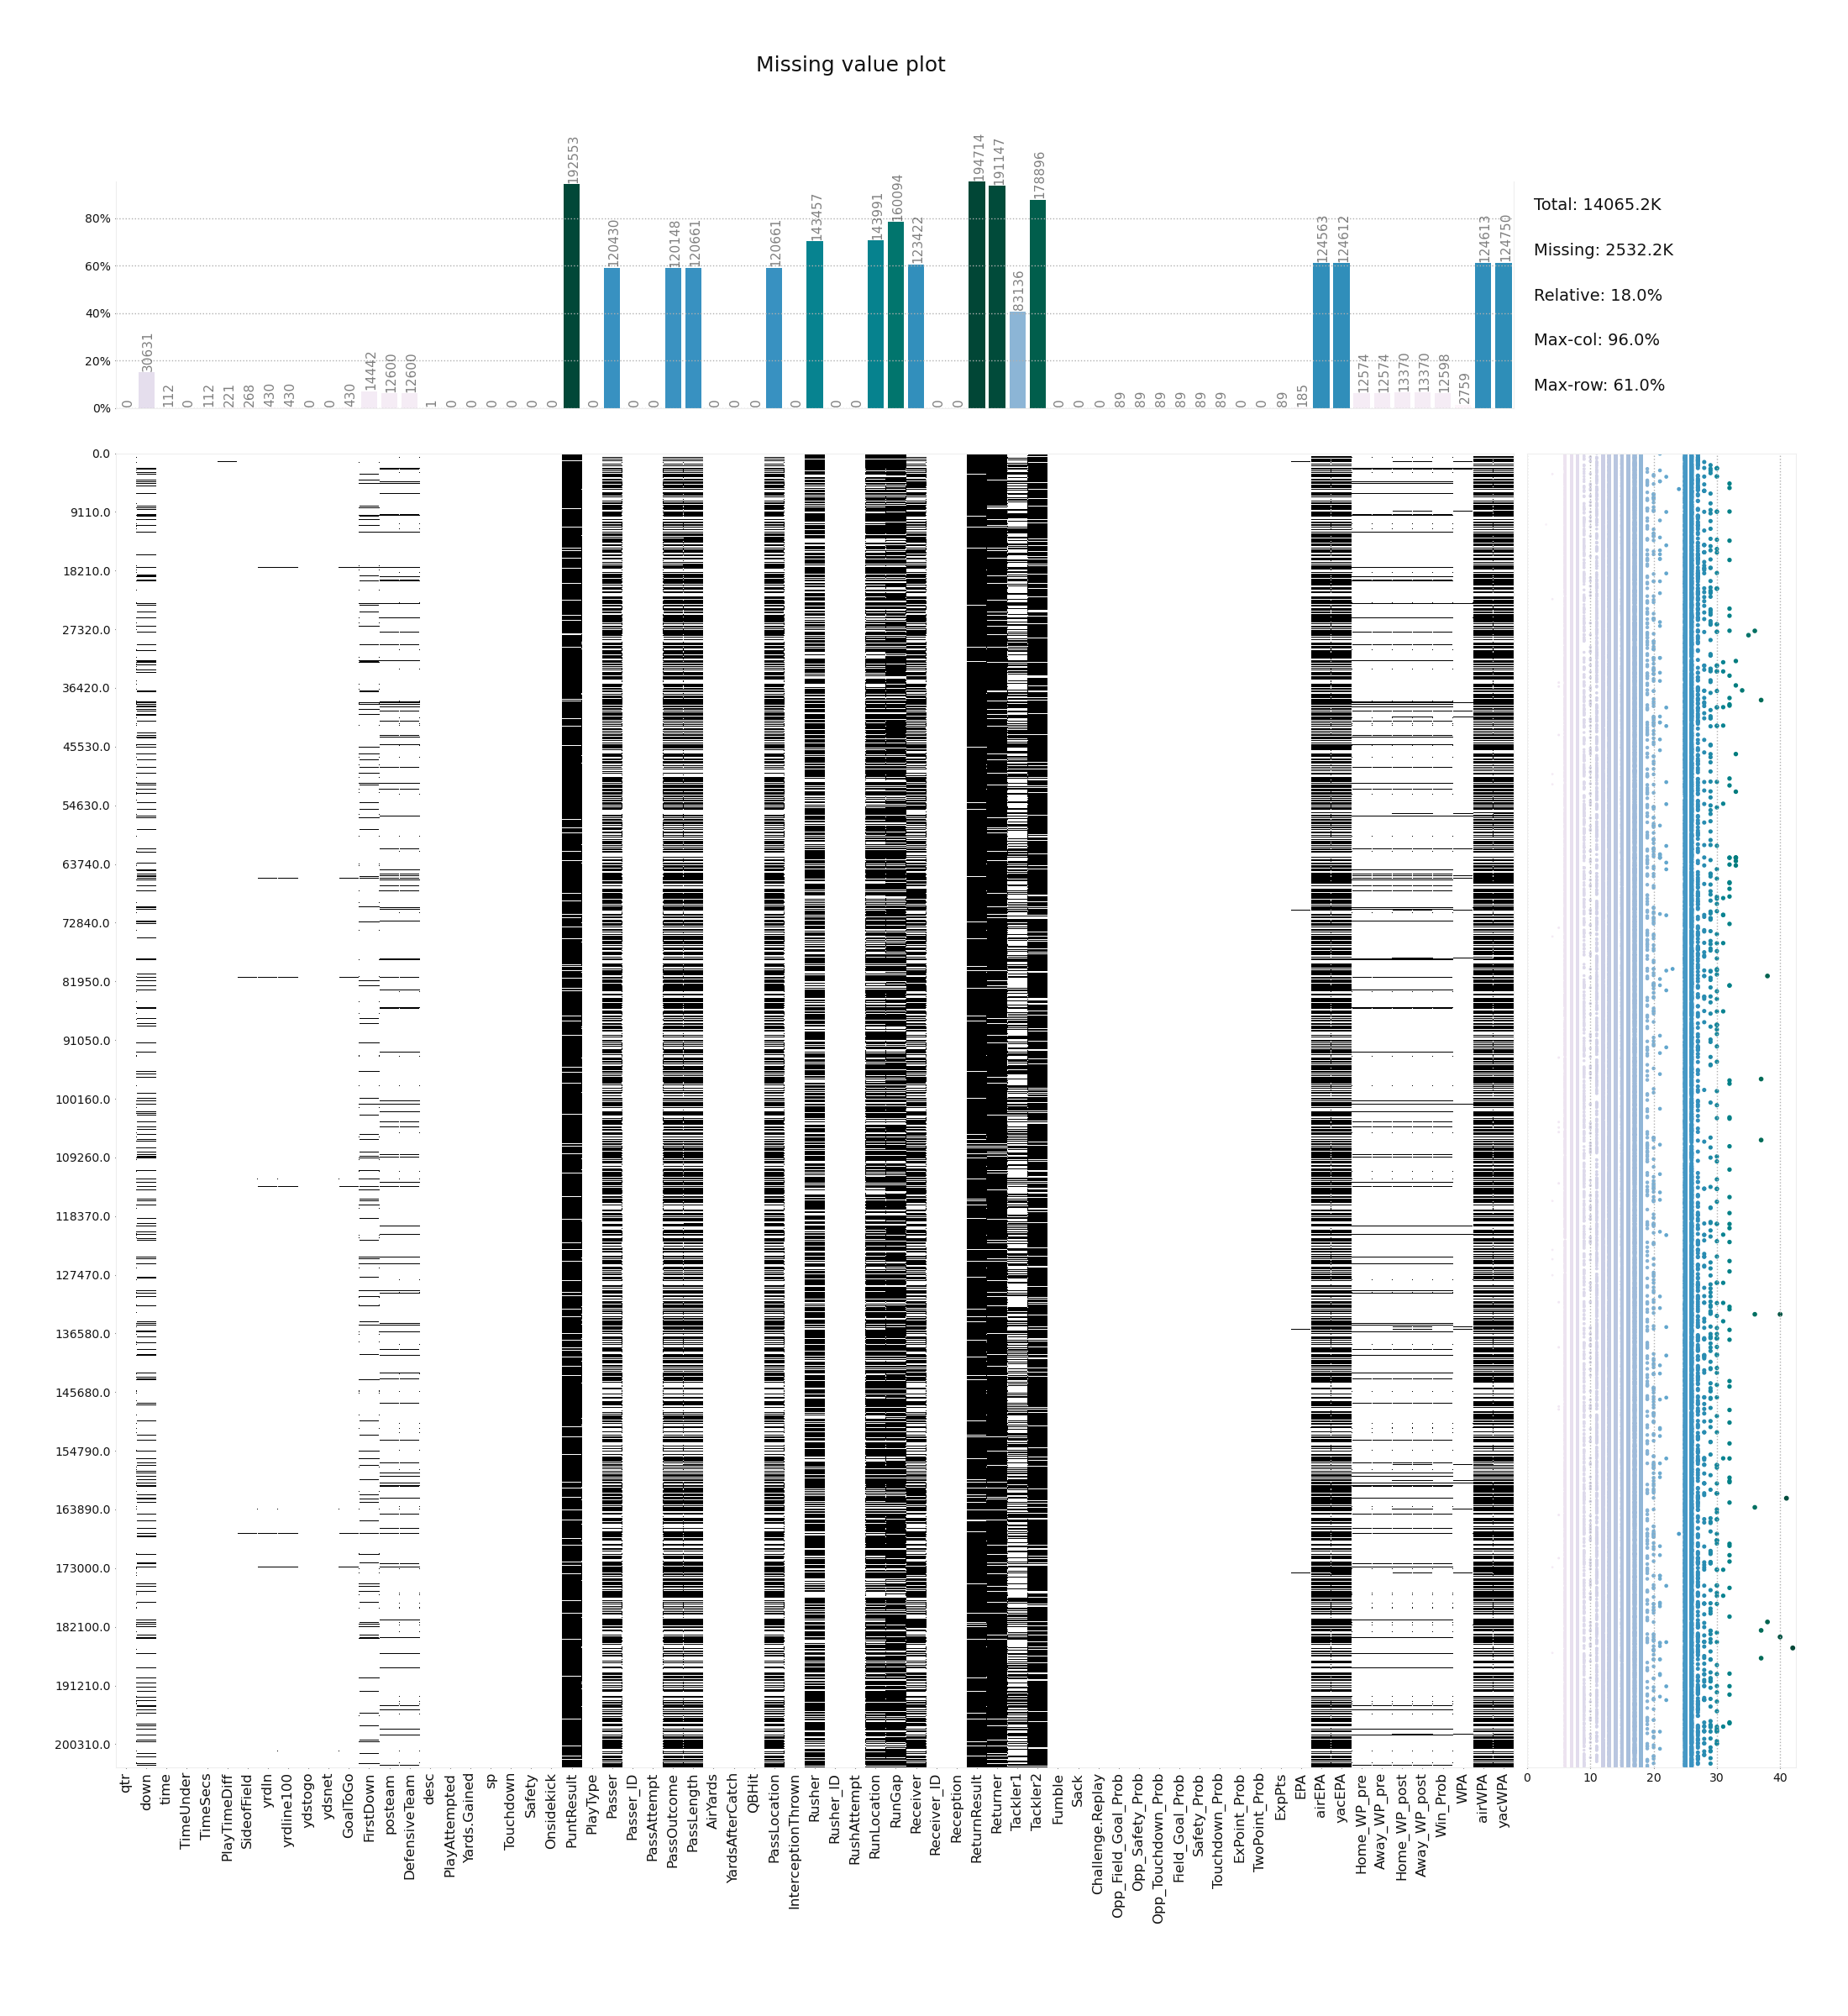
- klib.missingval_plot(df) # returns a figure containing information about missing values
# klib.clean - functions for cleaning datasets
- klib.data_cleaning(df) # performs datacleaning (drop duplicates & empty rows/cols, adjust dtypes,...)
- klib.clean_column_names(df) # cleans and standardizes column names, also called inside data_cleaning()
- klib.convert_datatypes(df) # converts existing to more efficient dtypes, also called inside data_cleaning()
- klib.drop_missing(df) # drops missing values, also called in data_cleaning()
- klib.mv_col_handling(df) # drops features with high ratio of missing vals based on informational content
- klib.pool_duplicate_subsets(df) # pools subset of cols based on duplicates with min. loss of information
```
## Examples
Find all available examples as well as applications of the functions in **klib.clean()** with detailed descriptions here.
```python
klib.missingval_plot(df) # default representation of missing values in a DataFrame, plenty of settings are available
```
```python
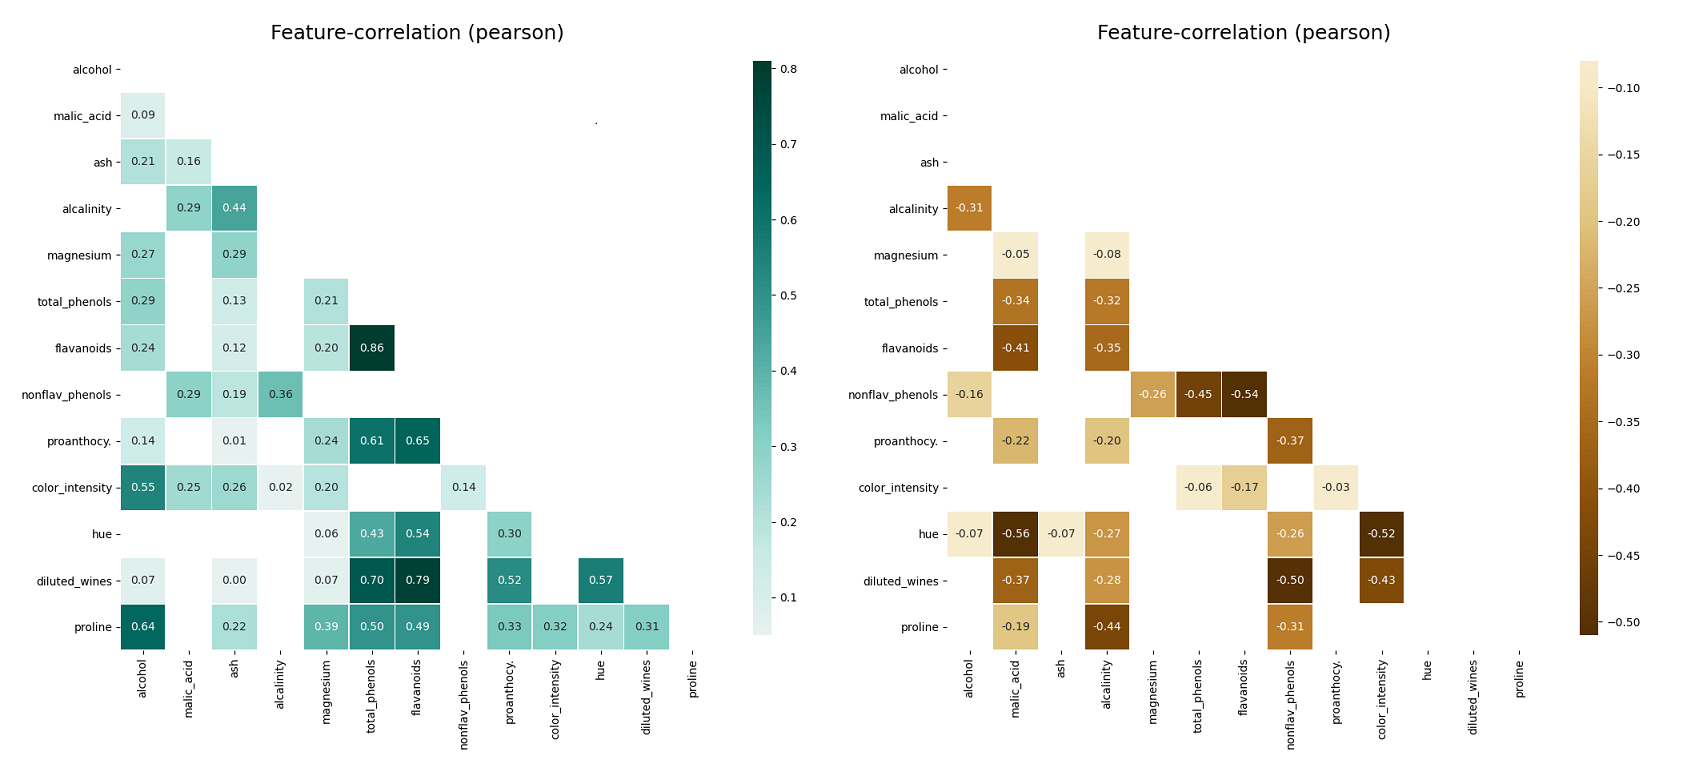
klib.corr_plot(df, split='pos') # displaying only positive correlations, other settings include threshold, cmap...
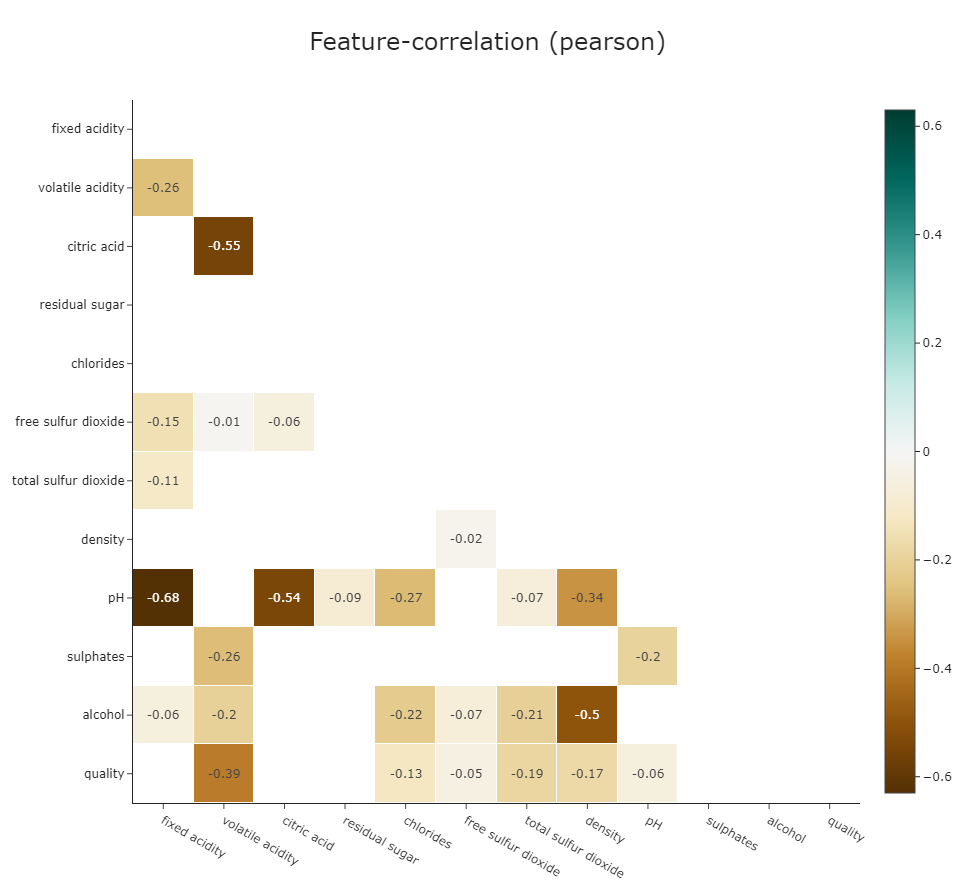
klib.corr_plot(df, split='neg') # displaying only negative correlations
```
```python
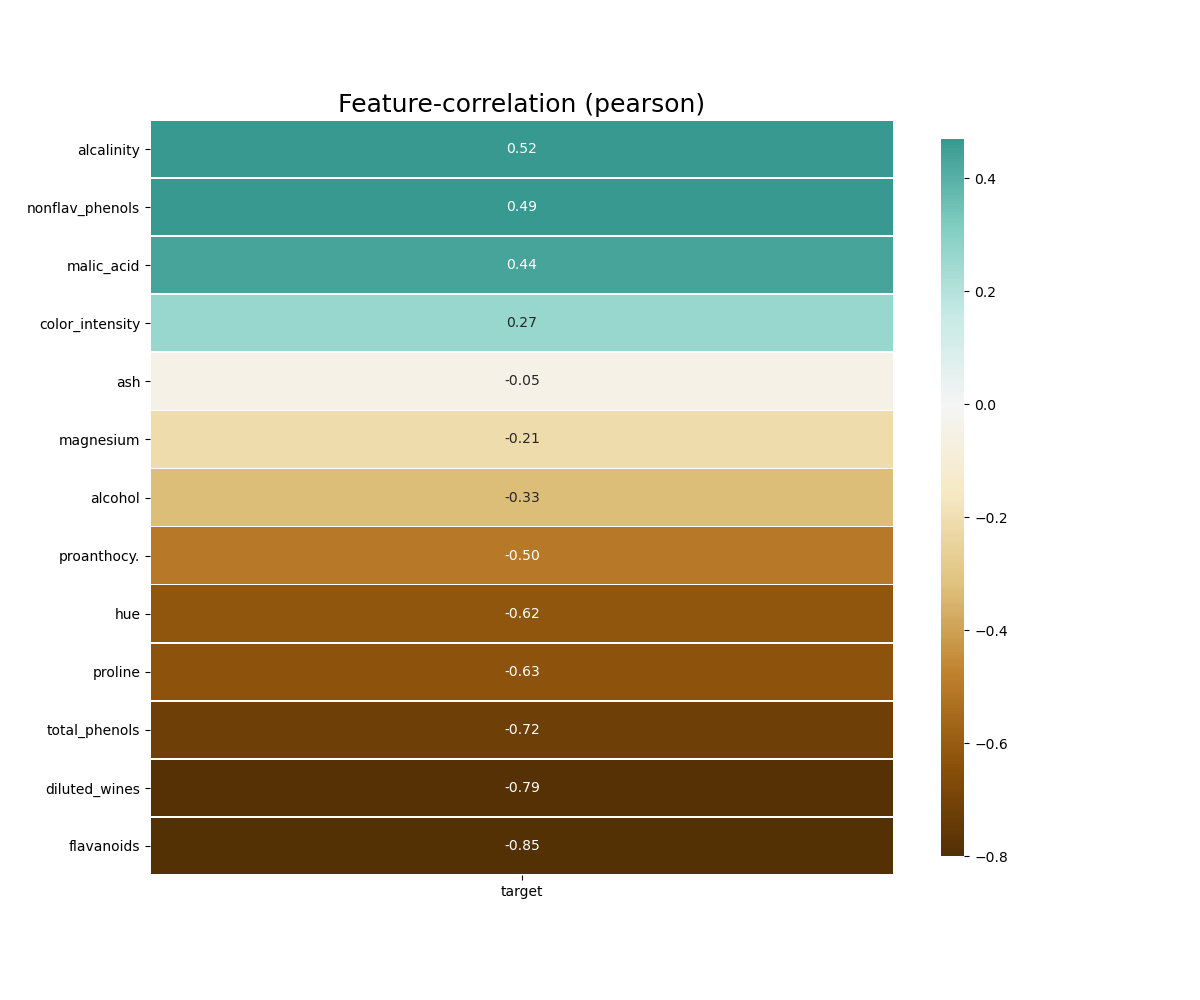
klib.corr_plot(df, target='wine') # default representation of correlations with the feature column
```
```python
klib.corr_interactive_plot(df, split="neg").show()
# The interactive plot has the same parameters as the corr_plot, but with additional Plotly heatmap graph object kwargs.
klib.corr_interactive_plot(df, split="neg", zmax=0)
```

```python
#Since corr_interactive_plot returns a Graph Object Figure, it supports the update_layout chain method.
klib.corr_interactive_plot(wine, split="neg").update_layout(template="simple_white")
```
```python
klib.dist_plot(df) # default representation of a distribution plot, other settings include fill_range, histogram, ...
```
```python
klib.cat_plot(data, top=4, bottom=4) # representation of the 4 most & least common values in each categorical column
```
Further examples, as well as applications of the functions in **klib.clean()** can be found here.
## Contributing
[](https://open.vscode.dev/akanz1/klib)
Pull requests and ideas, especially for further functions are welcome. For major changes or feedback, please open an issue first to discuss what you would like to change.
## License
[MIT](https://choosealicense.com/licenses/mit/)