https://github.com/akkefa/pycon-python-performance-profiling
Examples of using common Python profiling techniques
https://github.com/akkefa/pycon-python-performance-profiling
cprofile profiling pycon python
Last synced: 9 months ago
JSON representation
Examples of using common Python profiling techniques
- Host: GitHub
- URL: https://github.com/akkefa/pycon-python-performance-profiling
- Owner: akkefa
- License: mit
- Created: 2018-11-13T09:35:21.000Z (over 7 years ago)
- Default Branch: master
- Last Pushed: 2019-05-24T18:13:08.000Z (about 7 years ago)
- Last Synced: 2025-03-22T17:03:59.196Z (over 1 year ago)
- Topics: cprofile, profiling, pycon, python
- Language: Jupyter Notebook
- Homepage:
- Size: 1.4 MB
- Stars: 12
- Watchers: 1
- Forks: 0
- Open Issues: 0
-
Metadata Files:
- Readme: README.md
- License: LICENSE
Awesome Lists containing this project
README
# Python Performance Profiling

## HELLO!
I am **Ikram Ali**
+ Data Scientist @ Arbisoft
+ Working on Deep learning projects for Kayak
+ Github.com/akkefa
+ Linkedin.com/in/akkefa
# What is Profiling?

### Profiling Definition?
+ Measuring the execution time.
+ Insight of run time performance of a given piece of code.
+ Frequently used to optimize execution time.
+ Used to analyze other characteristics such as memory consumption.
# What is Python Profiling?
+ Measure Performance
# Why Profile?
```
You can use a profiler to answer questions like these:
```
+ Why is this program slow?
+ Why does it slow my computer to a crawl?
+ What is actually happening when this code executes?
+ Is there anything I can improve?
+ How much memory consumed by program?
+ How much time taken by each function execution?
# Why You should care about Performance
+ “If You Can’t Measure It, You Can’t Manage It.”
+ Writing efficient code saves money in modern "cloud economy" (e.g. you need fewer VM instances).
+ Even if you don't use clouds, a particular problem domain can have strict performance requirements (e.g. when you have to process a chunk of data in time before the next chunk arrives).
# Available options for measuring Performance
#### Command Line
#### time Module
#### timeit Module
#### cProfile Module
# Command Line
The **time** command is available in *nix systems.
```
$ time python some_program.py
```
```
real 0m4.536s
user 0m3.411s
sys 0m0.979s
```
+ Easy to use
+ Very limited information
+ Not very deterministic
+ Not available on Windows
# Python time Module
time.time() statements
```
import time
initial_time = time.time()
time.sleep(1)
final_time = time.time()
print('Duration: {}'.format(final_time - initial_time))
```
```
Duration: 1.0898
```
+ Easy to use
+ Simple to understand
+ Very limited information
+ Not very deterministic
+ Manual code modification and analysis
# Python timeit Module
```
import timeit
print('Plus:', timeit.timeit("['Hello world: ' + str(n) for n in range(100)]", number=1000))
print('Format:', timeit.timeit("['Hello world: {0}'.format(n) for n in range(100)]",
number=1000))
print('Percent:', timeit.timeit("['Hello world: %s' % n for n in range(100)]", number=1000))
```
+ Easy to use
+ Simple to understand
+ Measure execution time of small code snippets
+ Simple code only
+ Not very deterministic
+ Have to manually create runnable code snippets
+ Manual analysis
# cProfile Module
Best approach: cProfile
+ Python comes with two profiling tools, profile and cProfile.
+ Both share the same API, and should act the same.
```
>>> import cProfile
>>> cProfile.run('2 + 2')
```
```
3 function calls in 0.000 seconds
Ordered by: standard name
ncalls tottime percall cumtime percall filename:lineno(function)
1 0.000 0.000 0.000 0.000 :1()
1 0.000 0.000 0.000 0.000 {method 'disable' of '_lsprof.Profiler'}
```
### Running a script with cProfile
```
# slow.py
import time
def main():
sum = 0
for i in range(10):
sum += expensive(i // 2)
return sum
def expensive(t):
time.sleep(t)
return t
if __name__ == '__main__':
print(main())
```
```
python -m cProfile slow.py
```
```
25 function calls in 20.030 seconds
Ordered by: standard name
ncalls tottime percall cumtime percall filename:lineno(function)
10 0.000 0.000 20.027 2.003 slow.py:11(expensive)
1 0.002 0.002 20.030 20.030 slow.py:2()
1 0.000 0.000 20.027 20.027 slow.py:5(main)
1 0.000 0.000 0.000 0.000 {method 'disable' of '_lsprof.Profiler'objects}
1 0.000 0.000 0.000 0.000 {print}
1 0.000 0.000 0.000 0.000 {range}
10 20.027 2.003 20.027 2.003 {time.sleep}
```
## cProfile sort by options
**ncalls**
Total the number of calls of a function
**tottime**
for the total time spent in the given function
**cumtime**
is the cumulative time spent in this and all sub functions.
**filename:lineno(function)**
provides the respective data of each function
## cProfile result sorted by tottime
```
python -m cProfile -s tottime slow.py
```
```
25 function calls in 20.015 seconds
Ordered by: **internal time**
ncalls **tottime** percall cumtime percall filename:lineno(function)
10 **20.015** 2.001 20.015 2.001 {built-in method time.sleep}
1 **0.000** 0.000 0.000 0.000 {built-in method builtins.print}
1 **0.000** 0.000 20.015 20.015 slow.py:6(main)
10 **0.000** 0.000 20.015 2.001 slow.py:13(expensive)
1 **0.000** 0.000 20.015 20.015 slow.py:3()
1 **0.000** 0.000 20.015 20.015 {built-in method builtins.exec}
1 **0.000** 0.000 0.000 0.000 {method 'disable' of '_lsprof.Profiler' objects}
```
### cProfile result sorted by ncalls
```
python -m cProfile -s ncalls slow.py
```
```
25 function calls in 20.015 seconds
Ordered by: **call count**
**ncalls** tottime percall cumtime percall filename:lineno(function)
**10** 20.020 2.002 20.020 2.002 {built-in method time.sleep}
**10** 0.000 0.000 20.020 2.002 slow.py:13(expensive)
**1** 0.000 0.000 20.020 20.020 {built-in method builtins.exec}
**1** 0.000 0.000 0.000 0.000 {built-in method builtins.print}
**1** 0.000 0.000 20.020 20.020 slow.py:6(main)
**1** 0.000 0.000 20.020 20.020 slow.py:3()
**1** 0.000 0.000 0.000 0.000 {method 'disable' of '_lsprof.Profiler' objects}
```
### Easiest way to profile Python code
```
def main():
sum = 0
for i in range(10):
sum += expensive(i // 2)
return sum
def expensive(t):
time.sleep(t)
return t
if __name__ == '__main__':
pr = cProfile.Profile()
pr.enable()
main()
pr.disable()
pr.print_stats()
```
```
25 function calls in 20.030 seconds
Ordered by: standard name
ncalls tottime percall cumtime percall filename:lineno(function)
10 0.000 0.000 20.027 2.003 slow.py:11(expensive)
1 0.002 0.002 20.030 20.030 slow.py:2()
1 0.000 0.000 20.027 20.027 slow.py:5(main)
1 0.000 0.000 0.000 0.000 {method 'disable' of '_lsprof.Profiler'objects}
1 0.000 0.000 0.000 0.000 {print}
1 0.000 0.000 0.000 0.000 {range}
10 20.027 2.003 20.027 2.003 {time.sleep}
```
### We can also save the output!
```
if __name__ == '__main__':
pr = cProfile.Profile()
pr.enable()
main()
pr.disable()
**pr.dump_stats("profile.output")**
```
# How do we use the profiling information?
### pstats Module
+ You can use pstats to format the output in various ways.
+ pstats provides sorting options. **( calls, time, cumulative )**
```
import pstats
p = pstats.Stats("profile.output")
p.strip_dirs().sort_stats("calls").print_stats()
```
```
23 function calls in 20.019 seconds
Ordered by: call count
ncalls tottime percall cumtime percall filename:lineno(function)
10 20.019 2.002 20.019 2.002 {built-in method time.sleep}
10 0.000 0.000 20.019 2.002 slow.py:14(expensive)
1 0.000 0.000 0.000 0.000 {built-in method builtins.print}
1 0.000 0.000 20.019 20.019 slow.py:7(main)
```
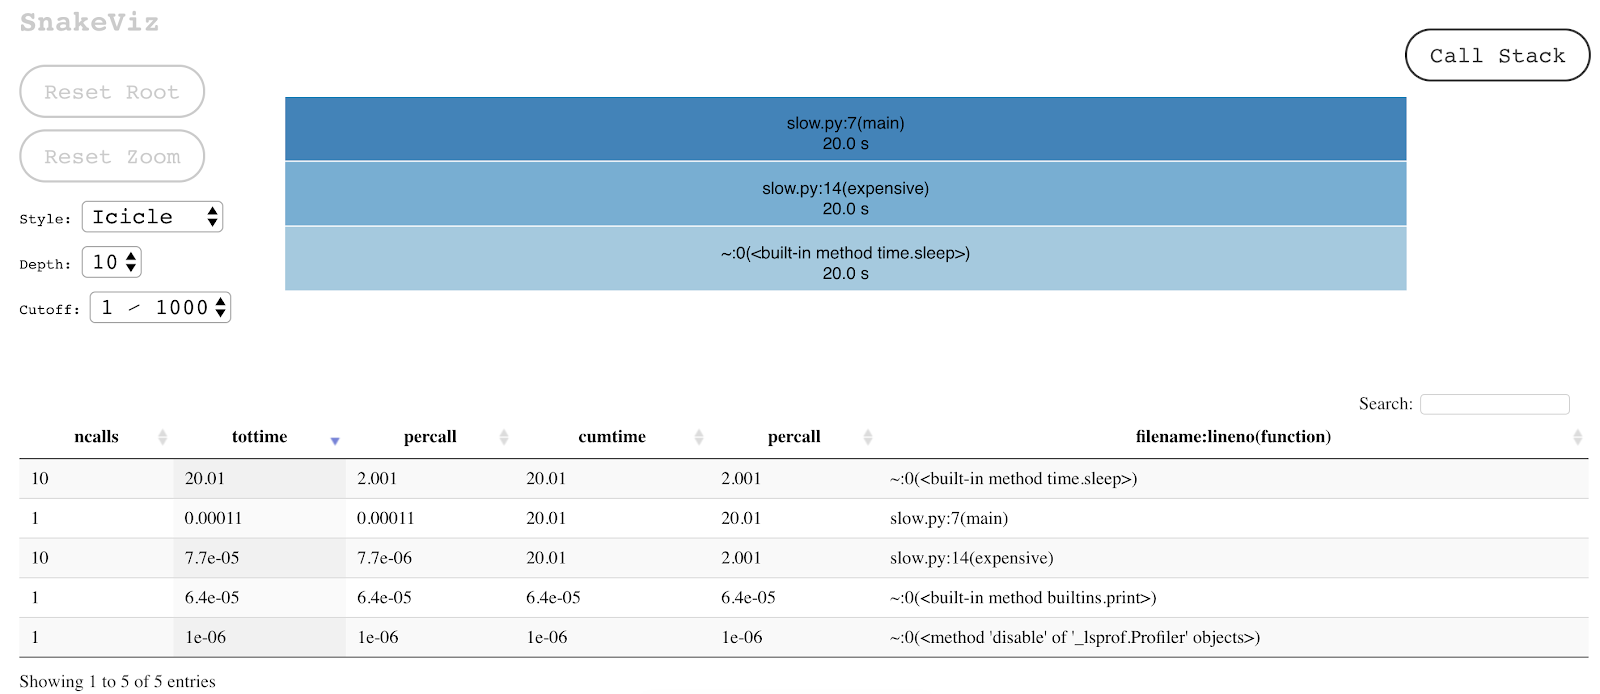
# An easy way to visualize cProfile results
### SNAKEVIZ library
```
pip install snakeviz
```
```
$ snakeviz profile.output
```
+ Snakeviz provides two ways to explore profiler data
+ Summaries Times
+ You can choose the sorting criterion in the output table
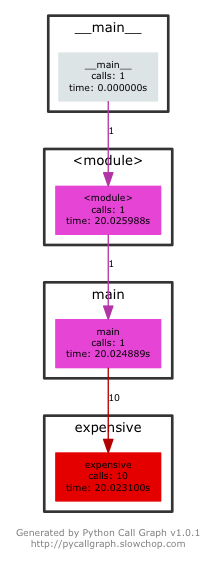
### PyCallGraph library
```
pip install pycallgraph
```
```
$ pycallgraph graphviz -- python slow.py
```
+ Visual extension of cProfile.
+ Understand code structure and Flow
+ Summaries Times
+ Darker color represent more time spent.
# Other profiling options
### Line profiler
+ line_profiler will profile the time individual lines of code take to execute.
+ https://github.com/rkern/line_profiler
### Memory profiler
+ Monitoring memory consumption of a process.
+ line-by-line analysis of memory consumption.
+ https://pypi.org/project/memory_profiler/
# Live Example

```
https://github.com/akkefa/pycon-python-performance-profiling/profiling-demo.ipynb
```
# Thank you.
```
Linkedin.com/in/akkefa
Contact : mrikram1989@gmail.com
```