https://github.com/aksakalli/gtop
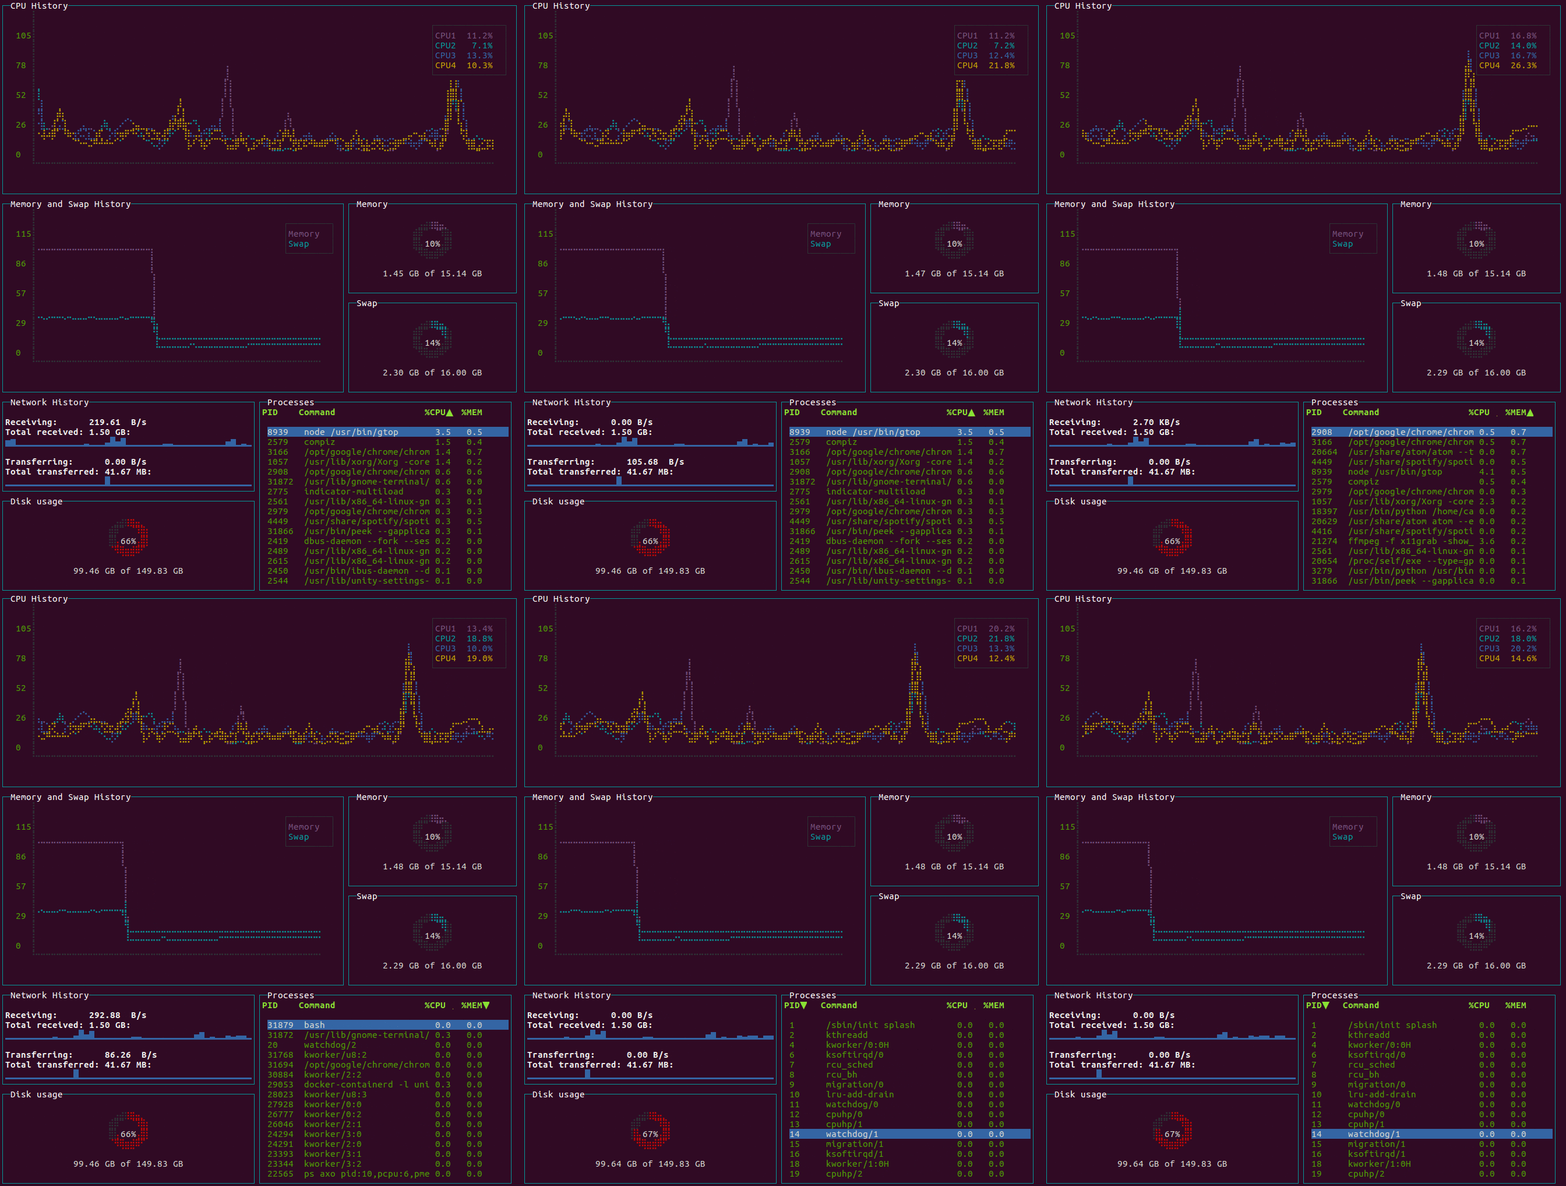
System monitoring dashboard for terminal
https://github.com/aksakalli/gtop
command-line monitoring nodejs system-monitoring top tui
Last synced: 11 months ago
JSON representation
System monitoring dashboard for terminal
- Host: GitHub
- URL: https://github.com/aksakalli/gtop
- Owner: aksakalli
- License: mit
- Created: 2017-08-09T15:12:28.000Z (over 8 years ago)
- Default Branch: master
- Last Pushed: 2024-04-16T20:31:23.000Z (almost 2 years ago)
- Last Synced: 2025-04-27T20:04:46.939Z (12 months ago)
- Topics: command-line, monitoring, nodejs, system-monitoring, top, tui
- Language: JavaScript
- Homepage:
- Size: 434 KB
- Stars: 9,803
- Watchers: 131
- Forks: 326
- Open Issues: 40
-
Metadata Files:
- Readme: README.md
- Contributing: .github/CONTRIBUTING.md
- License: LICENSE
Awesome Lists containing this project
- awesome-devenv - gtop
- awesome-tools - aksakalli/gtop - System monitoring dashboard for terminal (Monitoring / TOPs)
- fucking-Awesome-Linux-Software - ![Open-Source Software - A system monitoring dashboard for terminal. Think 'graphical top', with bar charts, line graphs, pie charts, and etc. (Command Line Utilities / System Info / Monitoring)
- Awesome-Linux-Software - ![Open-Source Software - A system monitoring dashboard for terminal. Think 'graphical top', with bar charts, line graphs, pie charts, and etc. (Command Line Utilities / System Info / Monitoring)
- awesome-engineering-toolbox - gtop - System monitoring dashboard for terminal with beautiful interface. (Linux System Tools / System Monitoring)
- awesome-nodejs - gtop - System monitoring dashboard for terminal - ★ 7074 (Command-line apps)
- awesome-node - gtop - System monitoring dashboard for the terminal. (Packages / Command-line apps)
- awesome-nodejs-cn - gtop - 终端的系统监控仪表板. (目录 / 命令行应用)
- awesome-terminals - gtop - System monitoring dashboard for terminal. (Tools / Node)
- awesome-nodejs-cn - gtop - 终端下的系统监控仪表板 (包 / 命令行程序)
- awesome-nodejs - gtop - System monitoring dashboard for the terminal. (Packages / Command-line apps)
- awesome-ricing - gtop - System monitoring dashboard for terminal. (js) (Packages / CLI Tools)
- awesome-nodejs - gtop - System monitoring dashboard for the terminal. (Packages / Command-line apps)
- awesome-fancy-toolkit - system monitoring dashboard for terminal, gtop
- awesome-cli-apps-in-a-csv - gtop - System monitoring dashboard for terminal written in Node.js. (<a name="monitor-top"></a>Process viewers and monitoring (alternatives to top))
- my-awesome-starred - aksakalli/gtop - System monitoring dashboard for terminal (JavaScript)
- awesome-nodejs-cn - gtop - **star:9770** 终端系统监控仪表板 ![star > 2000][Awesome] (包 / 命令行程序)
- awesome-starred - gtop - System monitoring dashboard for terminal (JavaScript)
- awesome-cli-apps - gtop - System monitoring dashboard for terminal written in Node.js. (<a name="monitor-top"></a>Process viewers and monitoring (alternatives to top))
- awesome-hacking-lists - aksakalli/gtop - System monitoring dashboard for terminal (JavaScript)
- awesome-discoveries - gtop - system monitoring dashboard for terminal _(`JavaScript`)_ (CLI Utilities)
- awesome-nodejs - gtop - System monitoring dashboard for the terminal. (Packages / Command-line apps)
- fucking-awesome-nodejs - gtop - System monitoring dashboard for the terminal. (Packages / Command-line apps)
- awesome - gtop - System monitoring dashboard for terminal (JavaScript)
README
# gtop

System monitoring dashboard for terminal.
[](https://npmjs.org/package/gtop)
[](https://npmjs.org/package/gtop)
[](https://snapcraft.io/gtop)
[](https://hub.docker.com/r/aksakalli/gtop)
[](https://hub.docker.com/r/aksakalli/gtop/builds)
### Requirements
* Linux / OSX / Windows (partial support)
* Node.js >= v8
### Installation
```sh
$ npm install gtop -g
```
#### Docker
You need to assign host `net` and `pid` to access the metrics in the host machine.
```sh
$ docker run --rm -it \
--name gtop \
--net="host" \
--pid="host" \
aksakalli/gtop
```
### Usage
Start gtop with the `gtop` command
```sh
$ gtop
```
To stop gtop use `q`, or `ctrl+c` in most shell environments.
You can sort the process table by pressing
* `p`: Process Id
* `c`: CPU usage
* `m`: Memory usage
### Troubleshooting
If you see question marks or other different characters, try to run it with these environment variables:
```sh
$ LANG=en_US.utf8 TERM=xterm-256color gtop
```
## License
Released under [the MIT license](LICENSE).