https://github.com/akshat2jain/covid_statewise_tracker_dashboard
In this I have created a covid tracker dashborad that will represent how many cases are found per states.It includes confirmed cases, deaths,recovered per statewise.
https://github.com/akshat2jain/covid_statewise_tracker_dashboard
chartjs css3 flexbox-css html5 javascript
Last synced: about 1 month ago
JSON representation
In this I have created a covid tracker dashborad that will represent how many cases are found per states.It includes confirmed cases, deaths,recovered per statewise.
- Host: GitHub
- URL: https://github.com/akshat2jain/covid_statewise_tracker_dashboard
- Owner: Akshat2Jain
- Created: 2022-03-09T13:25:30.000Z (over 4 years ago)
- Default Branch: master
- Last Pushed: 2022-03-18T12:38:37.000Z (over 4 years ago)
- Last Synced: 2025-07-21T11:03:54.536Z (11 months ago)
- Topics: chartjs, css3, flexbox-css, html5, javascript
- Language: CSS
- Homepage:
- Size: 1.62 MB
- Stars: 2
- Watchers: 1
- Forks: 0
- Open Issues: 0
-
Metadata Files:
- Readme: README.md
Awesome Lists containing this project
README
# Covid_statewise_tracker_dashboard
# It's Live-https://akshat2jain.github.io/Covid_statewise_tracker_dashboard/
# Find the code above
In this I have created a covid tracker dashborad that will represent how many cases are found per states.It includes confirmed cases, deaths,recovered per statewise using Html Css Vanilla Javascript
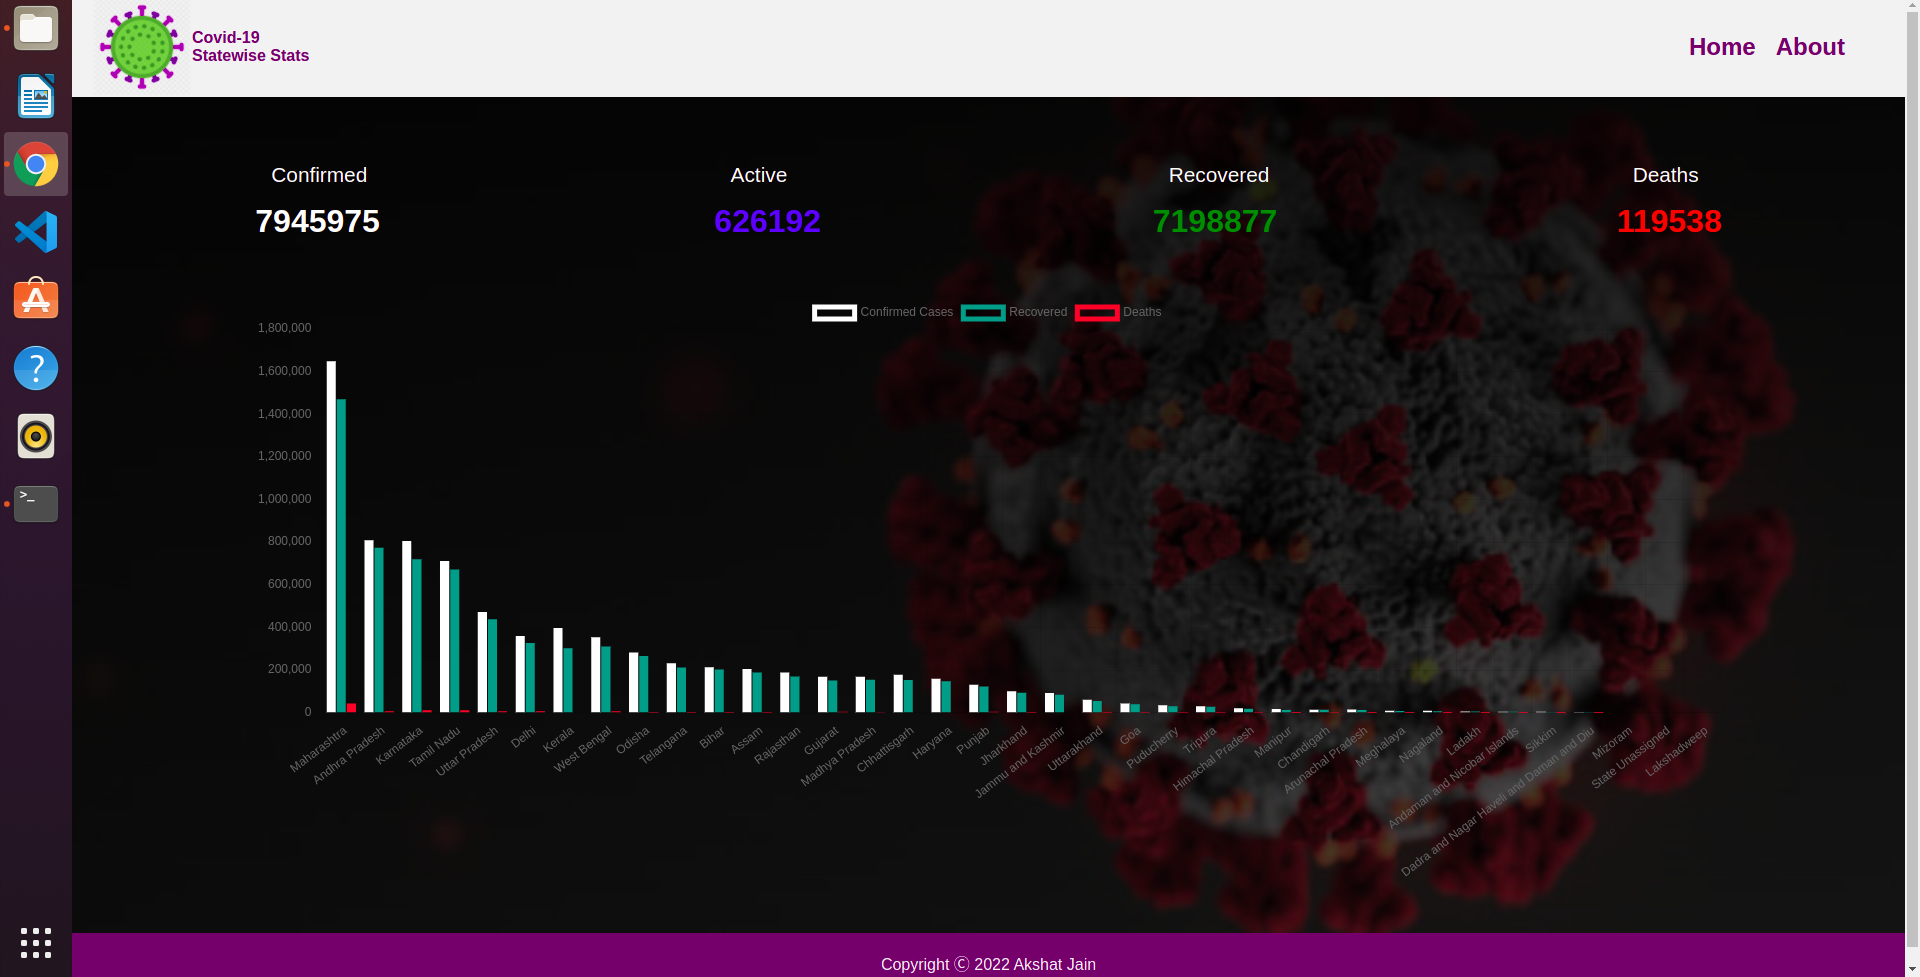
It shows Confirmed Cases.
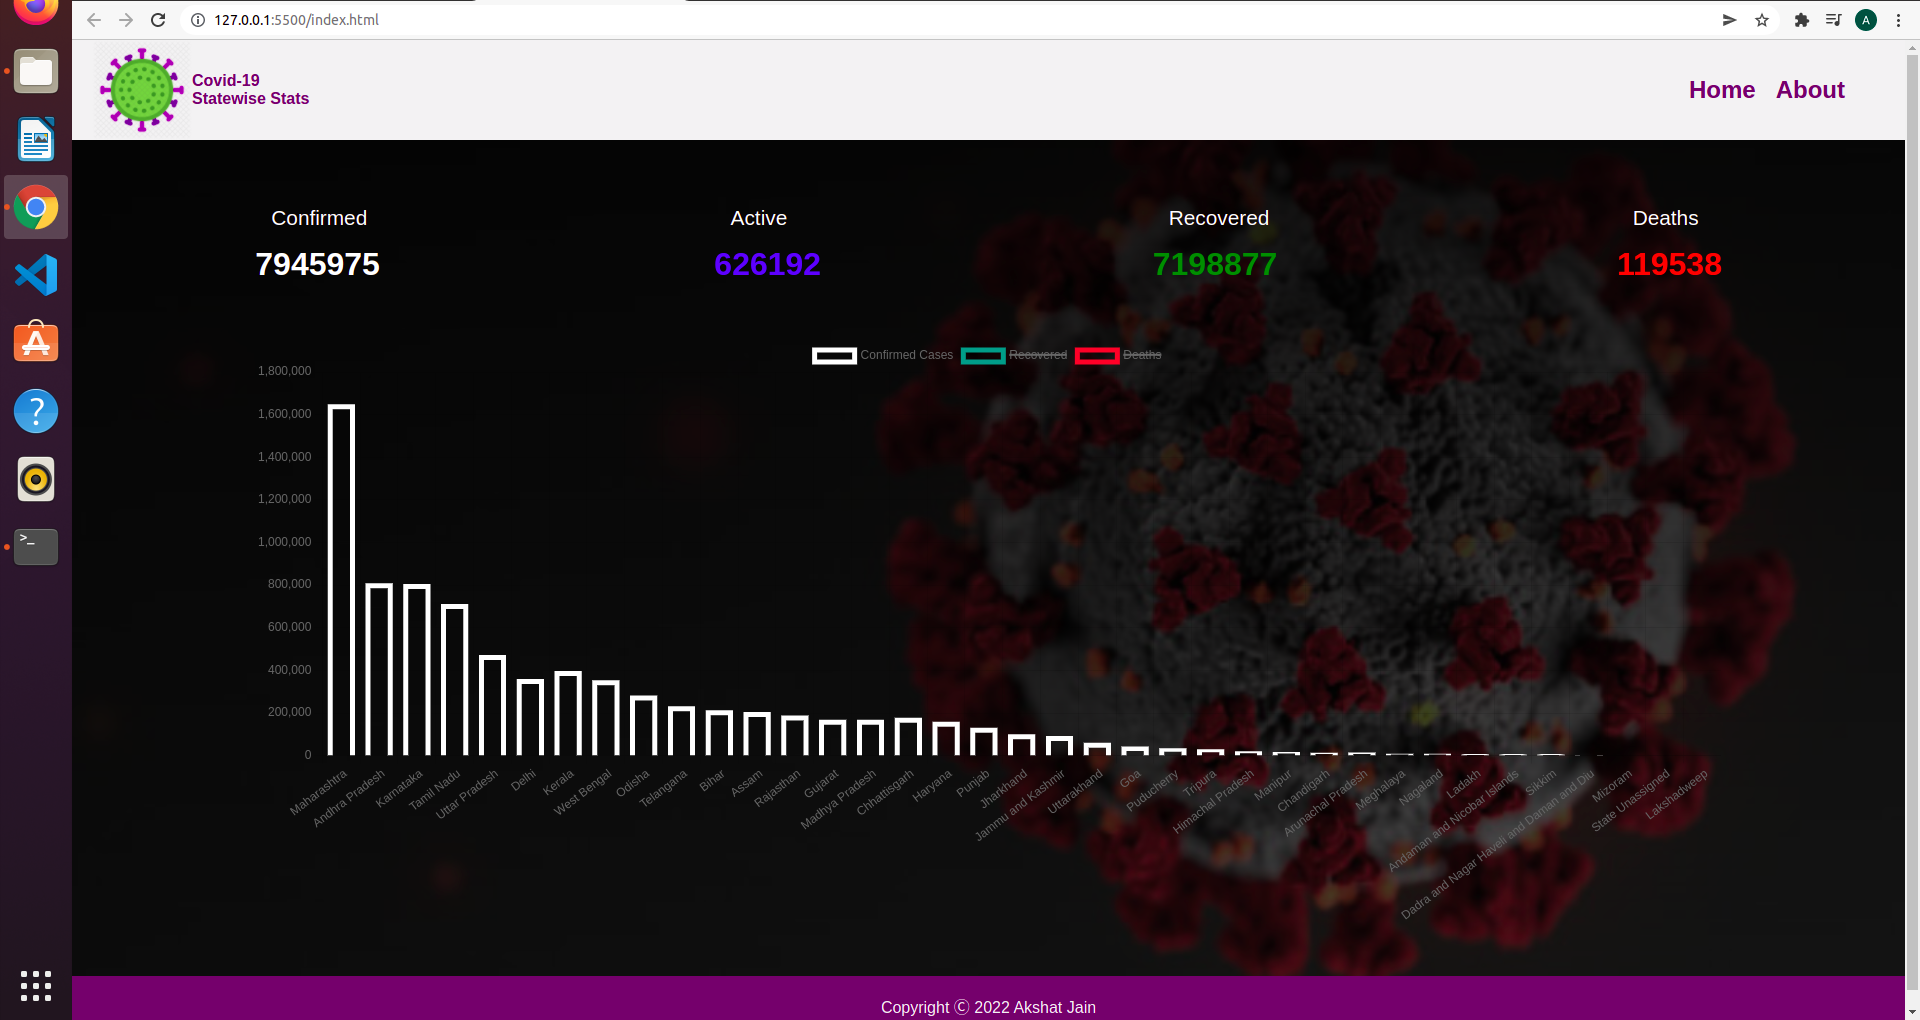
It shows recovered cases and deaths per states.
For chart I have used chat.js labeled one dimension as states and another dimension as number of cases
--------------------------------------------------------------------------------------------------------
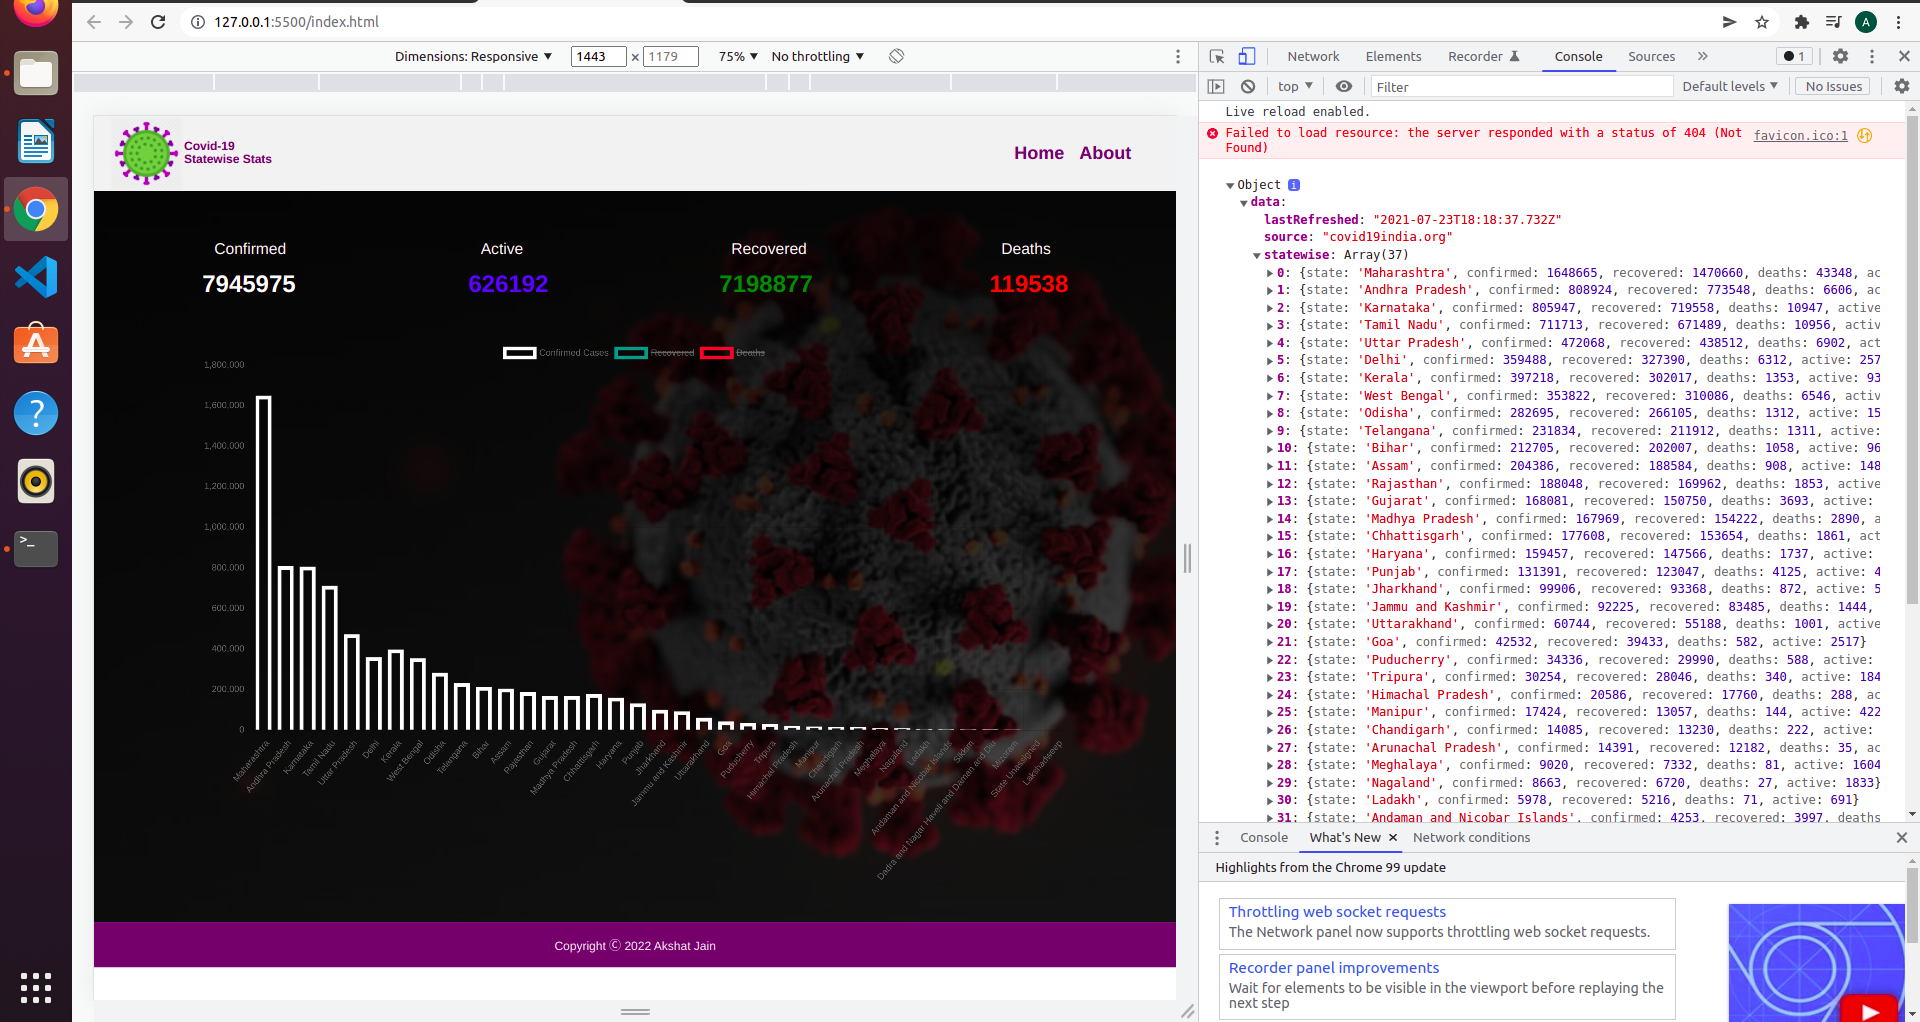
*Data Came from a api got it from rapidapi but it shows data from march 2020 to october 2021*
It is also fully responsive
----------------------------

In this I have learned how to apply chart.js library and how to fetch the data from a api
-----------------------------------------------------------------------------------------
*Thank You*