https://github.com/alexpresso/home-network-monitoring
Just a Grafana + Prometheus + node-exporter, docker-compose stack with persistence, I use to monitor my home network Raspberry Pi and other stuff.
https://github.com/alexpresso/home-network-monitoring
docker docker-compose grafana grafana-dashboard home monitoring network node-exporter prometheus raspberry-pi raspberrypi
Last synced: about 2 months ago
JSON representation
Just a Grafana + Prometheus + node-exporter, docker-compose stack with persistence, I use to monitor my home network Raspberry Pi and other stuff.
- Host: GitHub
- URL: https://github.com/alexpresso/home-network-monitoring
- Owner: AlexPresso
- Created: 2024-02-19T14:15:57.000Z (over 1 year ago)
- Default Branch: main
- Last Pushed: 2025-01-30T21:02:37.000Z (8 months ago)
- Last Synced: 2025-06-22T10:40:45.936Z (4 months ago)
- Topics: docker, docker-compose, grafana, grafana-dashboard, home, monitoring, network, node-exporter, prometheus, raspberry-pi, raspberrypi
- Homepage:
- Size: 188 KB
- Stars: 10
- Watchers: 3
- Forks: 0
- Open Issues: 0
-
Metadata Files:
- Readme: README.md
Awesome Lists containing this project
README
### Home Network Monitoring
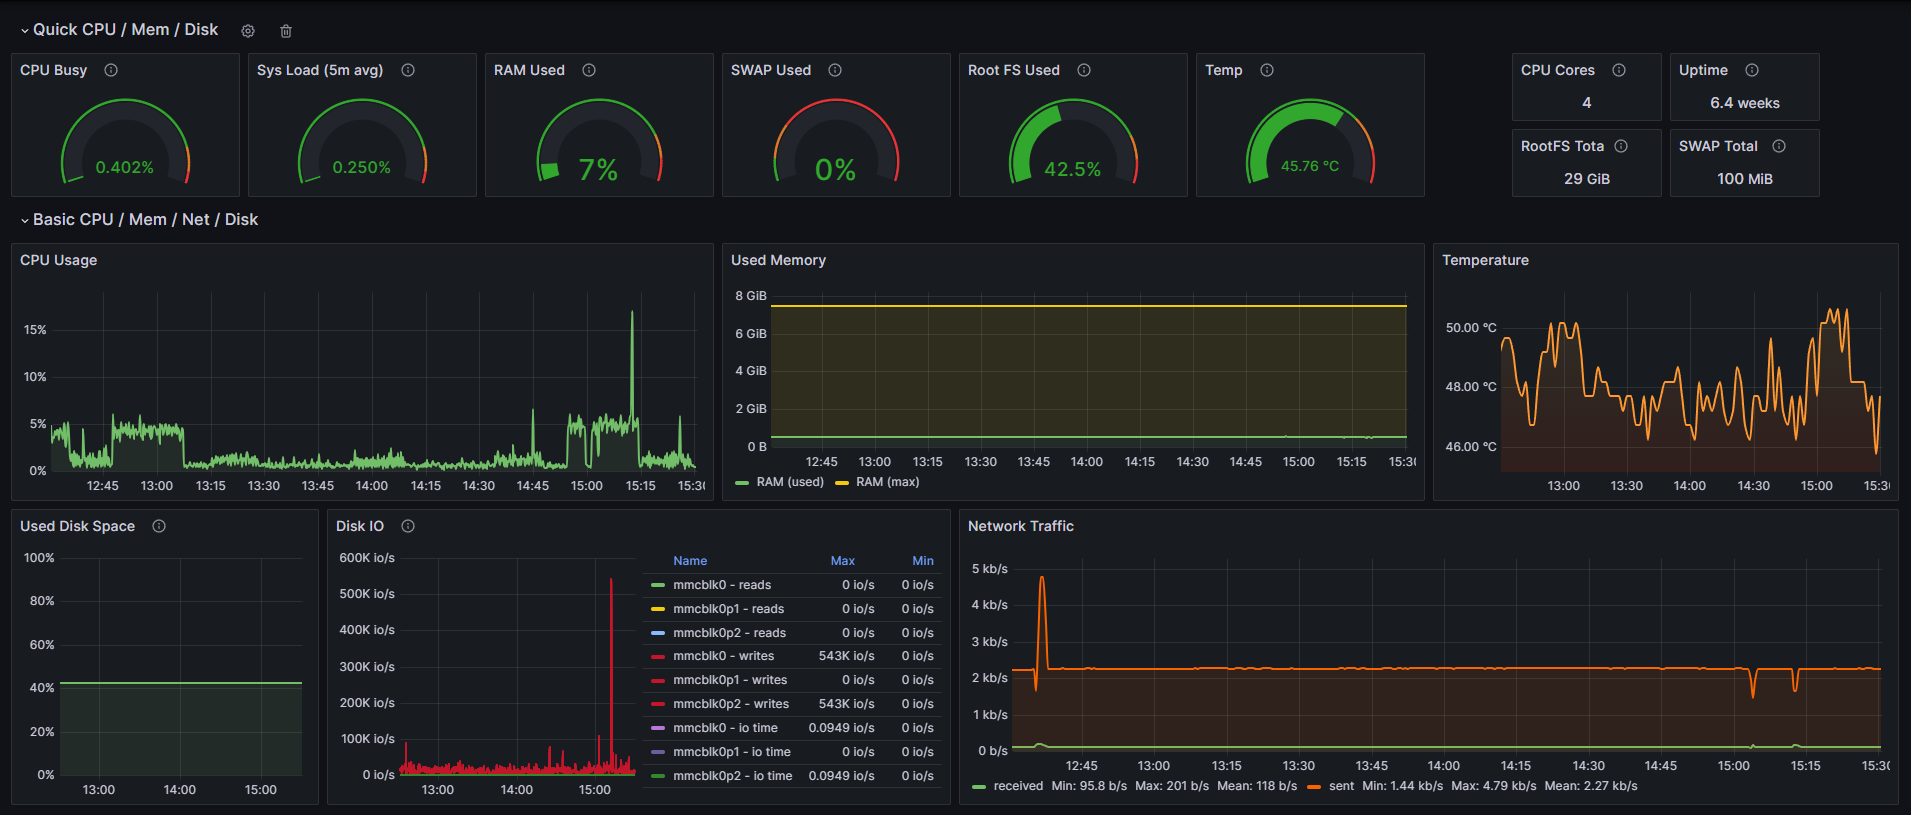
Just a [Grafana](https://grafana.com/) + [Prometheus](https://prometheus.io/) + [node-exporter](https://github.com/prometheus/node_exporter), docker-compose stack with persistence, I use to monitor my home network Raspberry Pi and other stuff.
### Requirements
- docker + docker-compose
### Installation
- Clone the repository anywhere you want
- `cd home-network-monitoring`
- `chown -R 472:472 grafana && chown -R 65534:65534 prometheus` (set owner id of these directories to allow containers to write in it as mounted volumes)
- `docker compose up -d`
- go to `http://:3000` to access Grafana and change default user/password (default: user=`admin` ; pass=`admin`)
- Have fun