https://github.com/alfurka/synloc
A Python Package to Create Synthetic Tabular Data
https://github.com/alfurka/synloc
clustering constrained-clustering copulas data-augmentation distributions k-means knn local-sampling machine-learning multivariate-distributions nonparametric-distribution oversampling python resampling sampling semi-parametric-modeling statistics synthetic synthetic-data synthetic-dataset-generation
Last synced: 5 months ago
JSON representation
A Python Package to Create Synthetic Tabular Data
- Host: GitHub
- URL: https://github.com/alfurka/synloc
- Owner: alfurka
- License: mit
- Created: 2022-08-30T04:20:27.000Z (almost 4 years ago)
- Default Branch: main
- Last Pushed: 2026-01-10T09:26:18.000Z (5 months ago)
- Last Synced: 2026-01-11T02:57:43.823Z (5 months ago)
- Topics: clustering, constrained-clustering, copulas, data-augmentation, distributions, k-means, knn, local-sampling, machine-learning, multivariate-distributions, nonparametric-distribution, oversampling, python, resampling, sampling, semi-parametric-modeling, statistics, synthetic, synthetic-data, synthetic-dataset-generation
- Language: Jupyter Notebook
- Homepage:
- Size: 41.8 MB
- Stars: 3
- Watchers: 1
- Forks: 0
- Open Issues: 1
-
Metadata Files:
- Readme: README.md
- Changelog: CHANGELOG.md
- License: LICENSE
Awesome Lists containing this project
README
# synloc: An Algorithm to Create Synthetic Tabular Data
[Overview](#overview) | [Installation](#installation) | [A Quick Example](#a-quick-example) | [Documentation](https://alfurka.github.io/synloc/) | [How to cite?](#how-to-cite) | [Replication](#replication)
[](https://pypi.org/project/synloc) [](https://pypi.org/project/synloc) [](https://pepy.tech/project/synloc)
## Overview
`synloc` is an open-source Python package implementing the **Local Resampler (LR)** algorithm for generating synthetic tabular data while safeguarding privacy. It provides a computationally efficient and flexible approach to synthetic data generation, enabling researchers to work with privacy-preserving datasets that maintain statistical utility.
### Two Subsampling Strategies
Both approaches provide effective disclosure control. Choose based on your priorities:
| Approach | Best for | Key advantage |
|----------|----------|---------------|
| **k-Nearest Neighbors (k-NN)** | Stronger disclosure control | Naturally underrepresents outliers, reducing privacy risks |
| **Clustering-based** | Efficiency & accuracy | Better data utility and computational performance |
**Key features:**
- Natural disclosure risk reduction by underrepresenting outliers (k-NN variant)
- Accurate replication of complex distributions, including multimodal and non-convex-support data
- Flexible trade-off between data utility and privacy protection
- Compatible with parametric and nonparametric distributions
This implementation aligns with statistical agencies' safe data regulations, including the **k-anonymity** criterion and the **Five Safes** framework adopted by organizations such as the Australian Bureau of Statistics. For the full methodology and theoretical foundations, see the [paper referenced below](#how-to-cite).
## Installation
`synloc` can be installed through [PyPI](https://pypi.org/):
```
pip install synloc
```
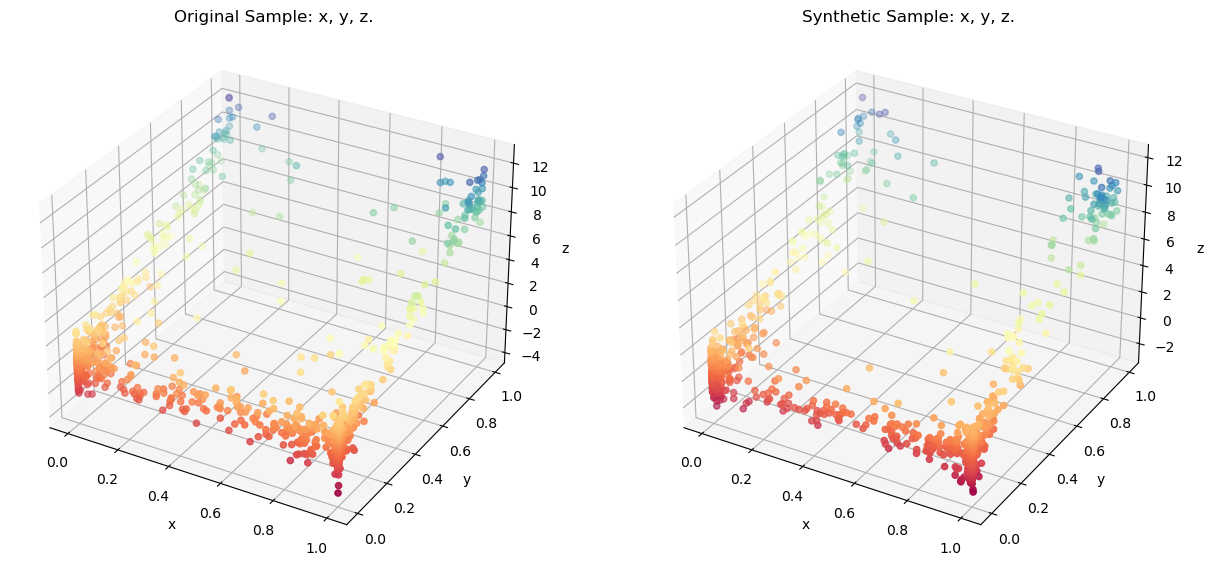
## A Quick Example
Assume that we have a sample with three variables with the following distributions:
$$x \sim Beta(0.1,\,0.1)$$
$$y \sim Beta(0.1,\, 0.5)$$
$$z \sim 10 y + Normal(0,\,1)$$
The distribution can be generated by `tools` module in `synloc`:
```python
from synloc.tools import sample_trivariate_xyz
data = sample_trivariate_xyz() # Generates a sample with size 1000 by default.
```
Initializing the resampler:
```python
from synloc import LocalCov
resampler = LocalCov(data = data, K = 30)
```
**Subsample** size is defined as `K=30`. Now, we locally estimate the multivariate normal distribution and from each estimated distributions we draw "synthetic values."
```python
syn_data = resampler.fit()
```
100%|██████████| 1000/1000 [00:01<00:00, 687.53it/s]
`syn_data` is a [pandas.DataFrame](https://pandas.pydata.org/docs/reference/api/pandas.DataFrame.html) where all variables are synthesized. Comparing the original sample using a 3-D Scatter:
```python
resampler.comparePlots(['x','y','z'])
```
## How to cite?
If you use `synloc` in your research, please cite the following paper:
```bibtex
@article{kalay2025generating,
author = {Kalay, Ali Furkan},
title = {Generating Synthetic Data With Locally Estimated Distributions for Disclosure Control},
journal = {Australian \& New Zealand Journal of Statistics},
year = {2025},
volume = {n/a},
number = {n/a},
keywords = {clustering algorithms, computational statistics, k-nearest neighbours, statistical disclosure control, synthetic data},
doi = {10.1111/anzs.70032},
url = {https://onlinelibrary.wiley.com/doi/abs/10.1111/anzs.70032}
}
```
## Replication
For replication materials of the paper, see the [replication folder](replication/).