https://github.com/alienobserver/datengeist
Application for easy understanding of unstructured data
https://github.com/alienobserver/datengeist
feature-engineering machine-learning streamlit
Last synced: 5 months ago
JSON representation
Application for easy understanding of unstructured data
- Host: GitHub
- URL: https://github.com/alienobserver/datengeist
- Owner: alienobserver
- License: apache-2.0
- Created: 2024-11-28T11:29:00.000Z (over 1 year ago)
- Default Branch: main
- Last Pushed: 2024-11-30T05:37:30.000Z (over 1 year ago)
- Last Synced: 2025-09-25T08:57:30.420Z (9 months ago)
- Topics: feature-engineering, machine-learning, streamlit
- Language: Python
- Homepage:
- Size: 572 KB
- Stars: 2
- Watchers: 1
- Forks: 0
- Open Issues: 0
-
Metadata Files:
- Readme: README.md
- License: LICENSE
Awesome Lists containing this project
README
# Datengeist
## Application for easy understanding of unstructured data
Datengeist is a streamlit built application which is made to understand unstructured data through visualization
of its components. Datengeist is working with **.csv** files. Datengeist has this key functionalities:
1. Categorization of features
2. Visualization of distributions
3. Convenient handling of missing data
4. Tools for feature comparison
To run datengeist you can install via pip
```
$ pip install datengeist
$ datengeist start
```
Or you can create a virtual environment and then run it (recommended)
```
$ python3 -m venv datengeist_env
$ source datengeist_env/bin/activate
$ pip install datengeist
```
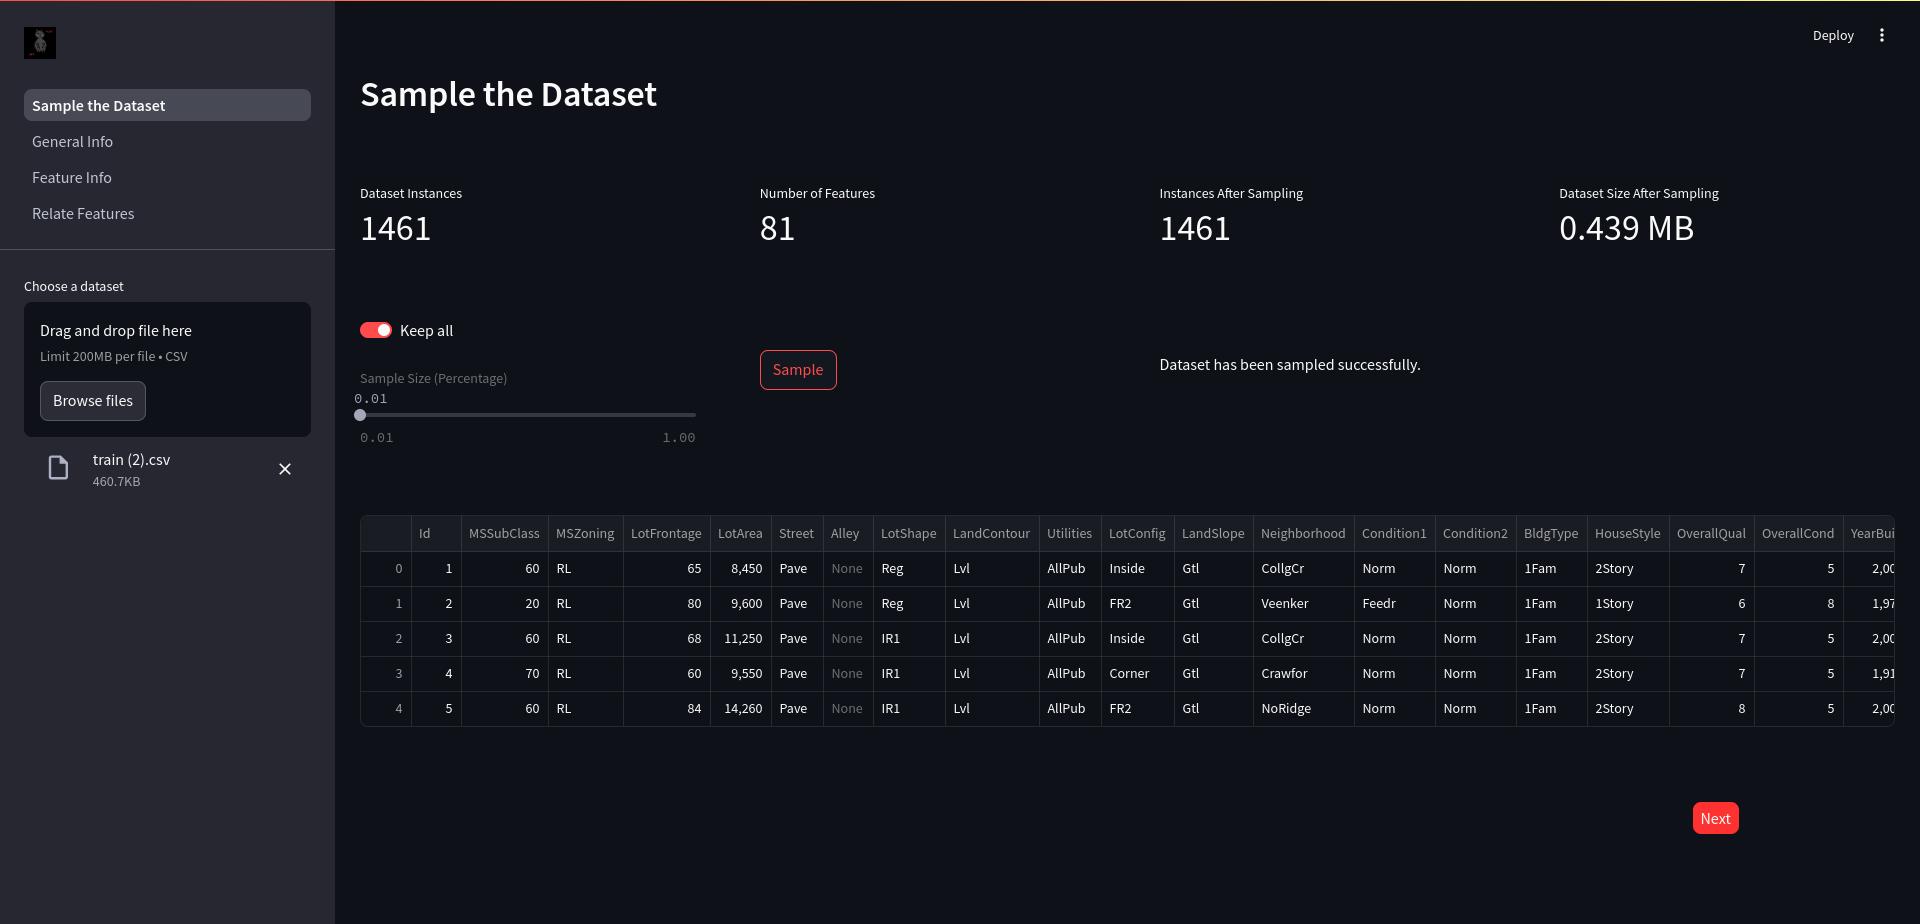
### 1. Sample the Dataset
Sample the Dataset is where you can sample data, load it and have your first overview of the data
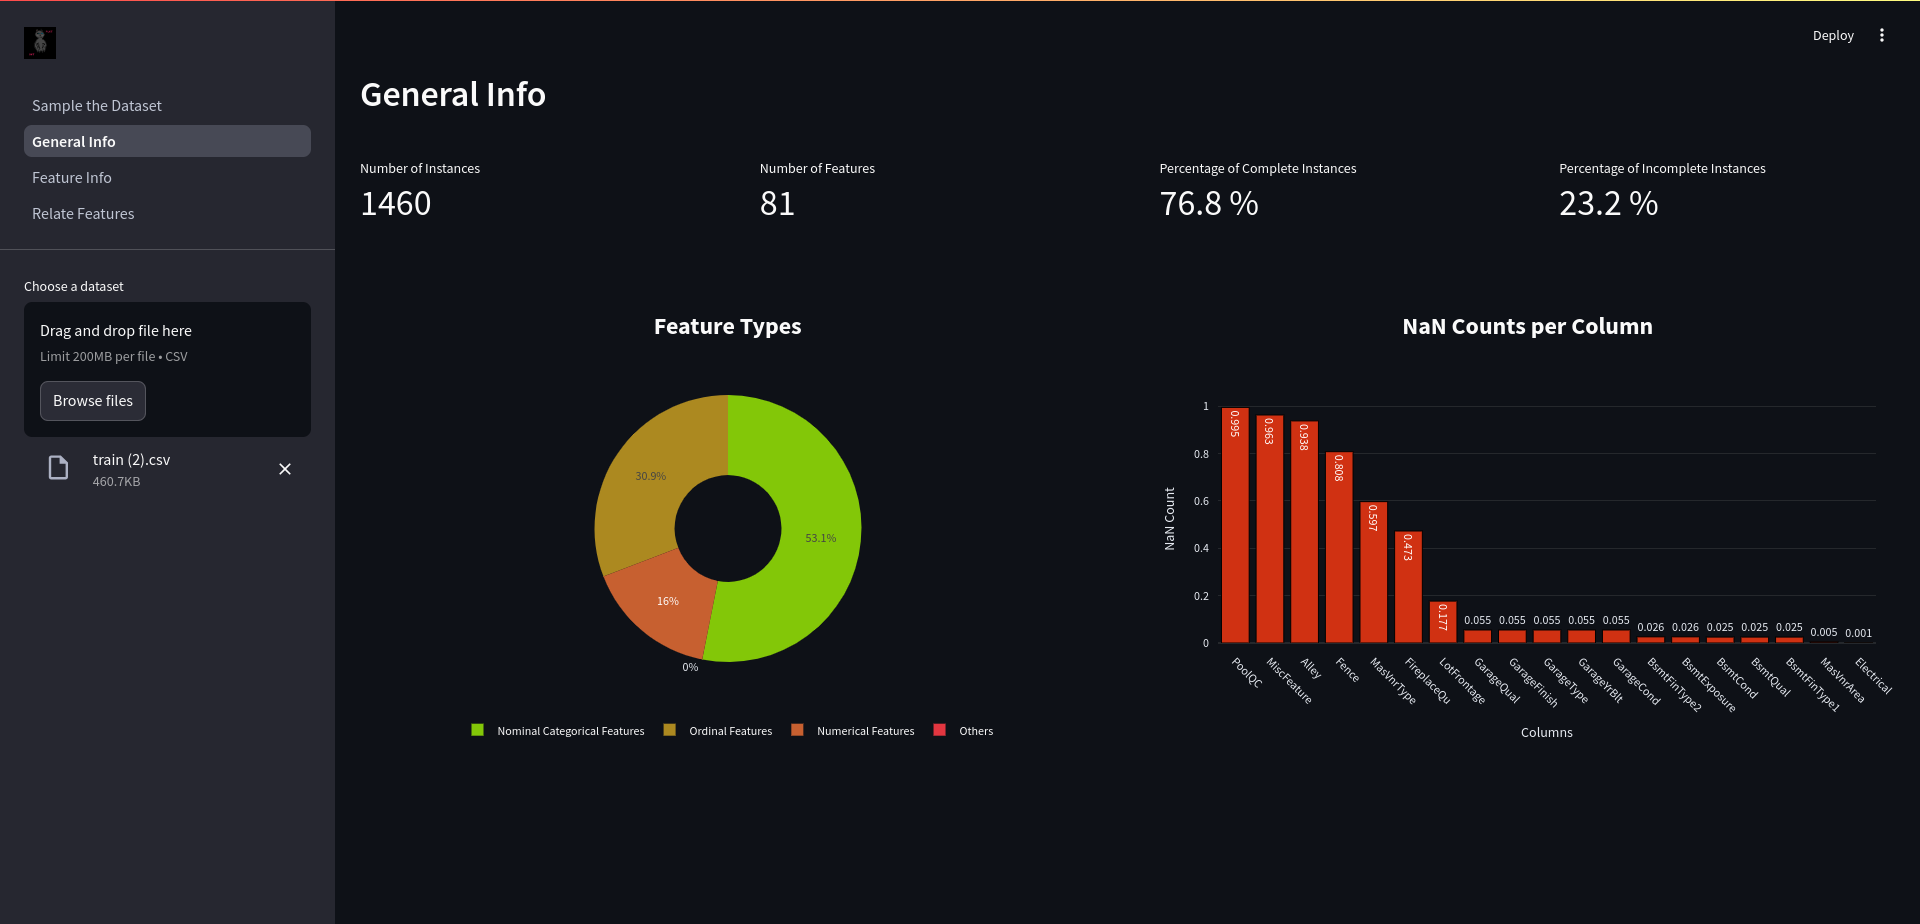
### 2. General Info
General Info is where you can divide your features into corresponding categories and view your
missing values in each feature
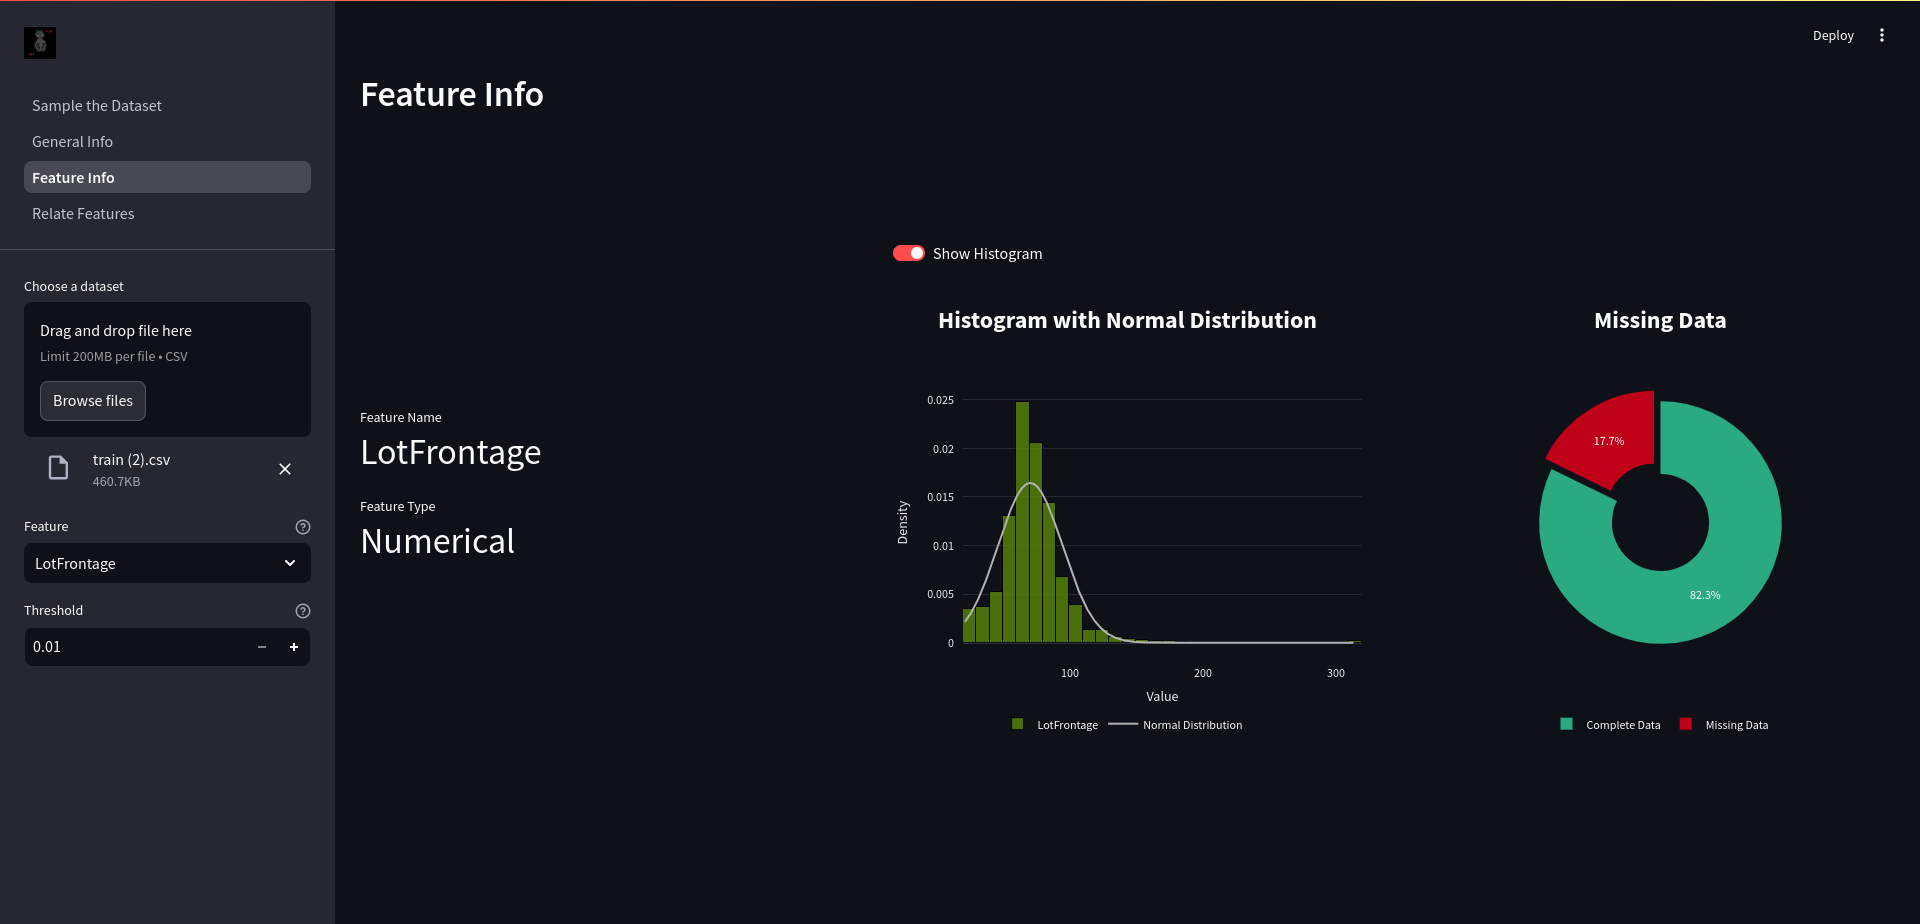
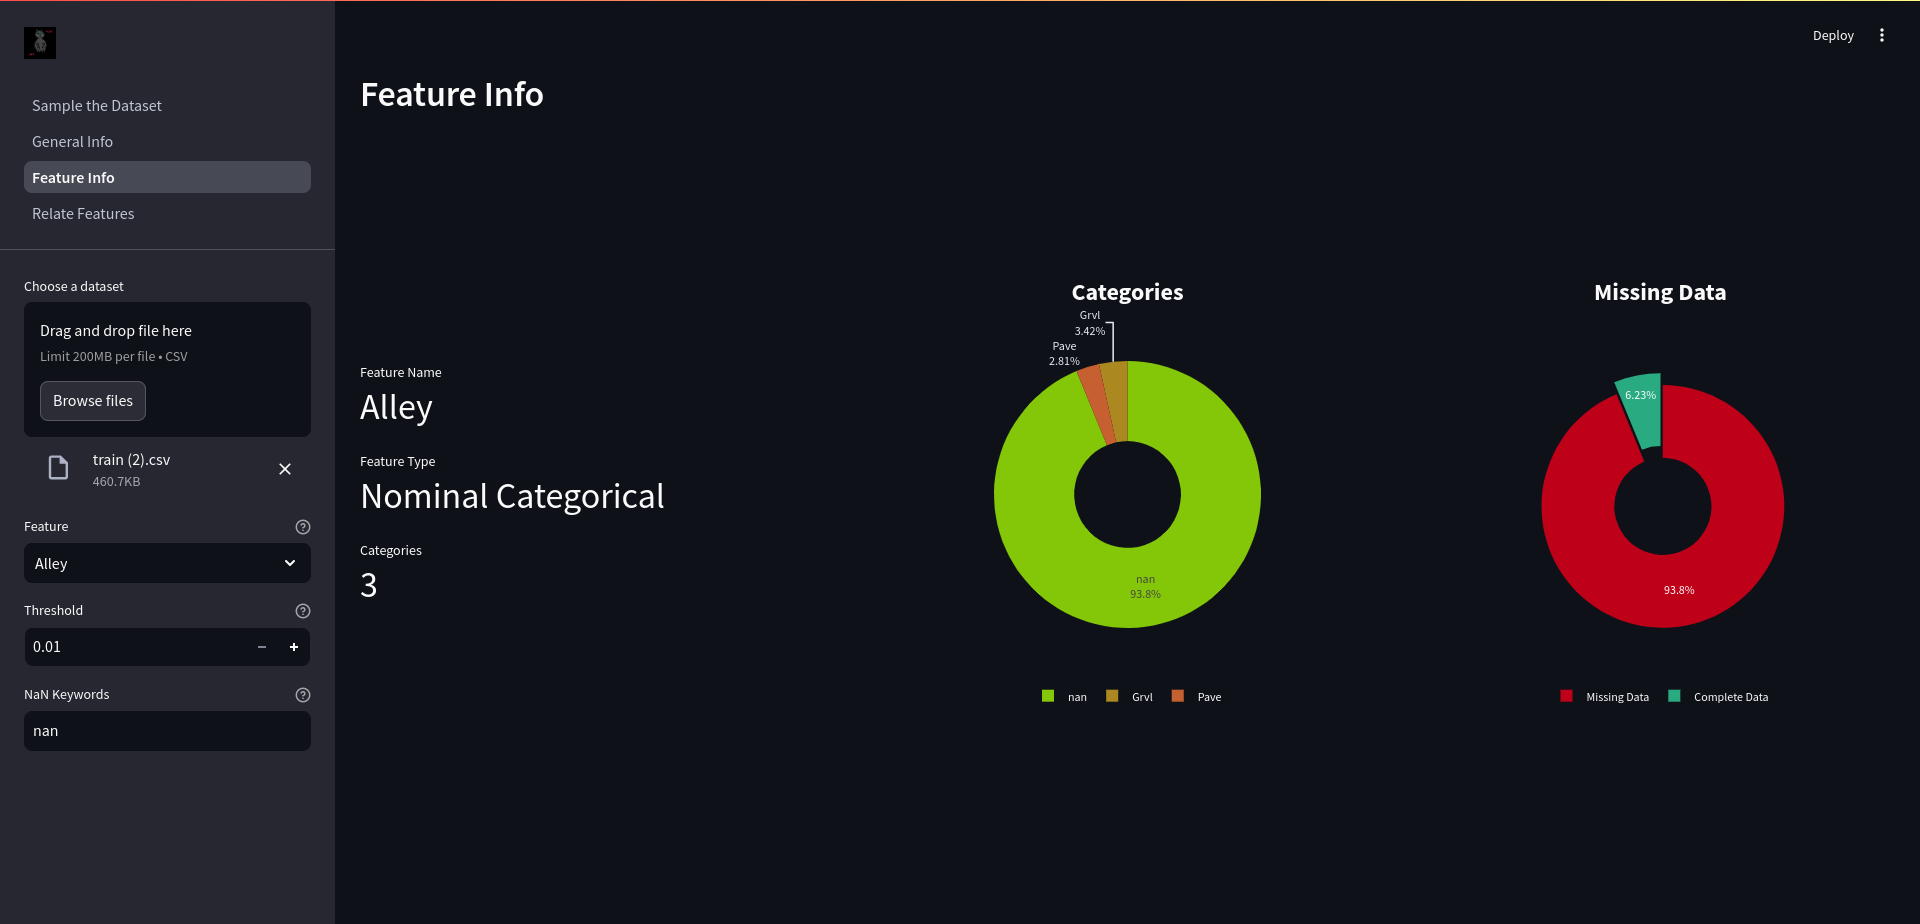
### 3. Feature Info
Feature Info is where you can view your features more closely, the distributions and missing value percentage
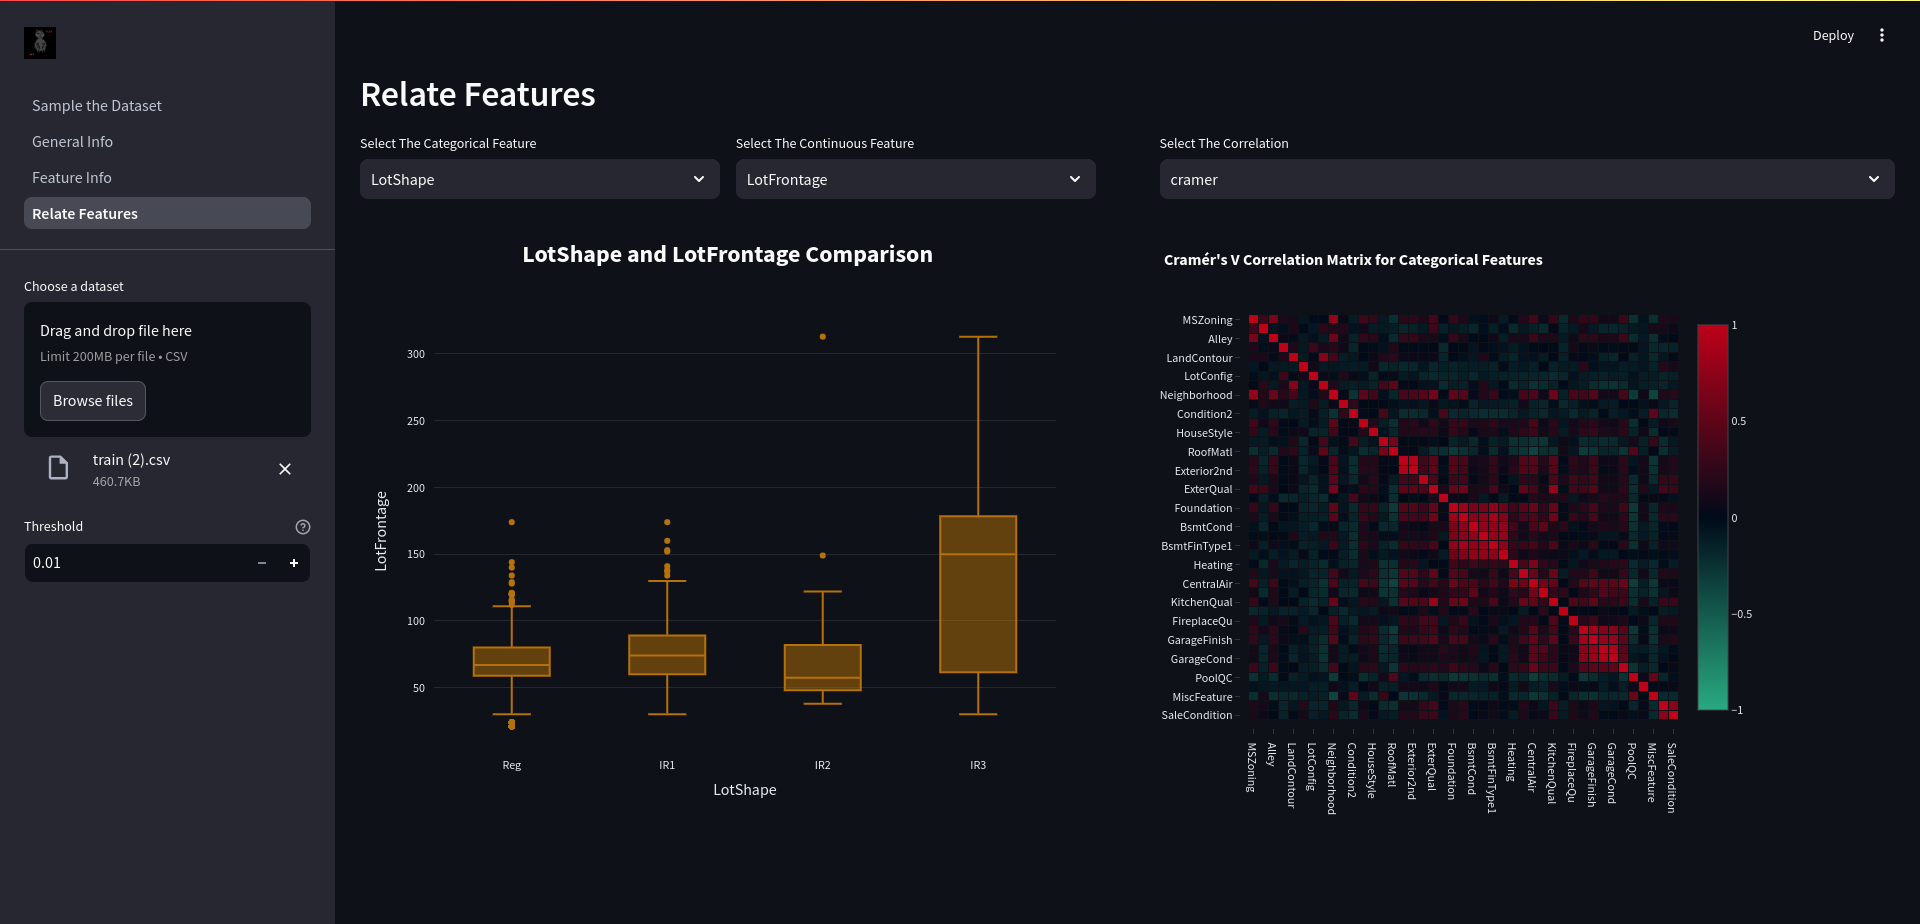
### 4. Relate Features
Relate Features is where you can view the correlation between your features and relate them via box plotting
### License
Apache 2.0