https://github.com/altair-viz/altair_viewer
Viewer for Altair and Vega-Lite visualizations
https://github.com/altair-viz/altair_viewer
Last synced: 8 months ago
JSON representation
Viewer for Altair and Vega-Lite visualizations
- Host: GitHub
- URL: https://github.com/altair-viz/altair_viewer
- Owner: altair-viz
- License: bsd-3-clause
- Archived: true
- Created: 2019-12-20T14:32:14.000Z (almost 6 years ago)
- Default Branch: master
- Last Pushed: 2024-03-30T17:00:31.000Z (over 1 year ago)
- Last Synced: 2024-08-02T19:37:56.900Z (over 1 year ago)
- Language: Python
- Homepage:
- Size: 2.96 MB
- Stars: 81
- Watchers: 8
- Forks: 12
- Open Issues: 0
-
Metadata Files:
- Readme: README.md
- Changelog: CHANGES.md
- License: LICENSE
Awesome Lists containing this project
- best-of-jupyter - GitHub
- awesome-jupyter-resources - GitHub - 42% open · ⏱️ 14.01.2022): (交互式小部件和可视化)
README
# Altair Viewer
**This repo is no longer maintained.**
Since Altair 5.3,
the functionality of Altair Viewer is now available in Altair via the [vl-convert](https://github.com/vega/vl-convert) package.
See [the docs on how to use the browser renderer](https://altair-viz.github.io/user_guide/display_frontends.html#browser-renderer) to display charts via `.show()`,
and the PR https://github.com/altair-viz/altair/pull/3379 for more details.
---
Offline chart viewer for [Altair](http://altair-viz.github.io) visualizations
[](https://github.com/altair-viz/altair_viewer/actions?query=workflow%3Abuild)
[](https://github.com/altair-viz/altair_viewer/actions?query=workflow%3Alint)
[](https://github.com/psf/black)
This package provides tools for viewing Altair charts without a web connection in arbitrary Python
environments. Charts can be displayed either inline in a Jupyter notebook environment, or in a
separate browser window for use in any environment.

## Installation
Altair Viewer can be installed from the
[Python Package Index](http://pypi.org/project/altair_viewer) with ``pip``:
```
$ pip install altair_viewer
```
## Usage: General Environments
Altair viewer provides two top-level functions for displaying charts: ``display()`` and ``show()``.
Their intended use is slightly different:
```python
import altair_viewer
altair_viewer.display(chart)
```
``display(chart)`` is meant for use in interactive computing environments where
a single Python process is used interactively. It will serve a chart viewer at a localhost
URL, and any susequent chart created within the session will appear in the same window.
The background server will be terminated when the main Python process terminates, so this
is not suitable for standalone scripts.
```python
import altair_viewer
altair_viewer.show(chart)
```
``show(chart)`` is meant for use once at the end of a Python script. It does the
same as ``display()``, but automatically opens a browser window, and adds an input
prompt to prevent the script (and the server it creates) from terminating.
## Usage: IPython & Jupyter
Within Jupyter notebook, IPython terminal, and related environments that support
[Mimetype-based display](https://jupyterlab.readthedocs.io/en/stable/user/file_formats.html),
altair viewer can be used by enabling the ``altair_viewer`` renderer:
```python
import altair as alt
alt.renderers.enable('altair_viewer')
```
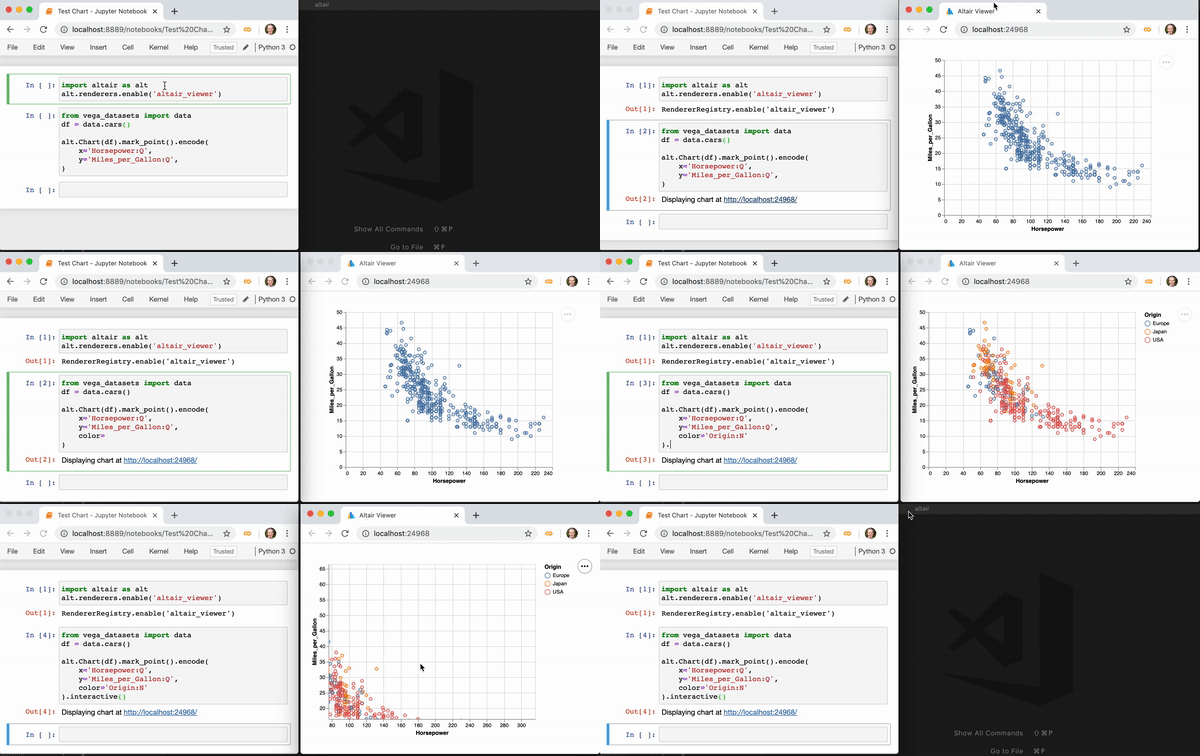
This will cause charts at the end of a Jupyter notebook cell to be rendered in a
separate browser window, as with the ``display()`` and ``show()`` methods.
If enabled with ``inline=True``, charts will be rendered inline in the notebook:
```python
import altair as alt
alt.renderers.enable('altair_viewer', inline=True)
```
To display a single inline chart using Altair viewer in an IPython environment without
globally enabling the associated renderer, you can use the ``display`` method directly:
```python
import altair_viewer
altair_viewer.display(chart, inline=True)
```
Note that the display based on altair viewer will only function correctly as long as the
kernel that created the charts is running, as it depends on the background server started
by the kernel. In particular, this means that if you save a notebook and reopen it later,
charts will not display until the associated cells are re-run.