https://github.com/amidug/brazilpipeline
https://github.com/amidug/brazilpipeline
fastapi keras mlflow python scikit-learn tensorflow xgboost
Last synced: 2 months ago
JSON representation
- Host: GitHub
- URL: https://github.com/amidug/brazilpipeline
- Owner: AmiDug
- Created: 2025-03-03T22:18:02.000Z (over 1 year ago)
- Default Branch: master
- Last Pushed: 2025-03-30T21:39:00.000Z (about 1 year ago)
- Last Synced: 2025-03-30T22:27:22.043Z (about 1 year ago)
- Topics: fastapi, keras, mlflow, python, scikit-learn, tensorflow, xgboost
- Language: Python
- Homepage:
- Size: 1.58 MB
- Stars: 0
- Watchers: 1
- Forks: 0
- Open Issues: 0
-
Metadata Files:
- Readme: README.md
Awesome Lists containing this project
README
Description:
GPU-accelerated ML pipeline for price prediction based on this Kaggle dataset: https://www.kaggle.com/datasets/olistbr/brazilian-ecommerce?select=olist_order_payments_dataset.csv
Uses SciKit-Learn, Tensorflow, Keras and XGBoost models.
Open a local mlflow tracking server from (.venv): MLflow server --backend-store-uri sqlite:///instance/mlflow.db --default-artifact-root ./mlflow-artifacts --host 127.0.0.1 --port 8080
Serve a consumable FastAPI endpoint from (.venv): uvicorn api.main:app --host 0.0.0.0 --port 8000
You can run the pipeline from the API using curl commands or by visiting http://localhost:8000/docs
Report:
The pipeline will use both supervised and deep learning models to train different models so that we can compare their performance on the dataset.
The components of the pipeline are a data ingestion step that retrieves the datasets from the Kaggle API, merges them and then creates a Pandas dataframe.
The dataframe gets passed to data validation which ensures valid data types, values and outliers. If the data passes these checks then MLflow visualization charts are created.
Data transformation converts categorical values to numerical ones, imputes unknown values, removes price outliers, and does feature engineering.
Following transformation the data is split into training (78,707 samples) and testing (33,732 samples) sets using a 70/30 ratio with controlled randomization to ensure reproducibility.
Model training creates 4 different models. A decision tree with a depth of 12. A random forest with a depth of 15 and 200 trees, a Keras neural network with batch normalization, dropout regularization, early stopping and learning rate scheduling to prevent overfitting. Finally there is an XGBoost model that is GPU-accelerated with a depth of 12, 500 boosting rounds and built-in cross-validation.
Finally, model evaluation calculates each model's performance with metrics such as R^2, RMSE, MAE and MAPE, it also logs and creates artifacts in MLflow.
The datasets consists of around 100k transactions made between the years 2016 and 2018 from the Brazilian E-commerce website Olist[1].
There are many 9 different datasets including for customers, geolocation, order items, order payments, order reviews, orders, products, sellers and product categories.
All 9 datasets will be joined for the purposes of training the model and extracting valuable information regarding which features are useful for predicting the price of products during transactions.
Price prediction is very important for e-commerce websites to make sure they can maximize profits for the products they are selling in a data-informed way, if a bad price is given for a product
it can either lead to a net loss for the company or the price may be set so high that no transaction will be made at all, if the price is too high it may even lead to
claims of price gouging for the retailer which affects reputation and may even lead to legal action against the corporate entity.
According to our pipeline the merged datasets consist of 112650 rows with 52 columns, the disk size is 126.19 MB. 19 of the features were numerical while the rest were categorical.
The data was cleaned through various means. 8427 price outliers were identified and and 211 in the 99.9th percentile were removed,
extreme outliers can overly bias the data despite making up a small amount of the total number of entries.
The price distribution following this step can be seen in this image:
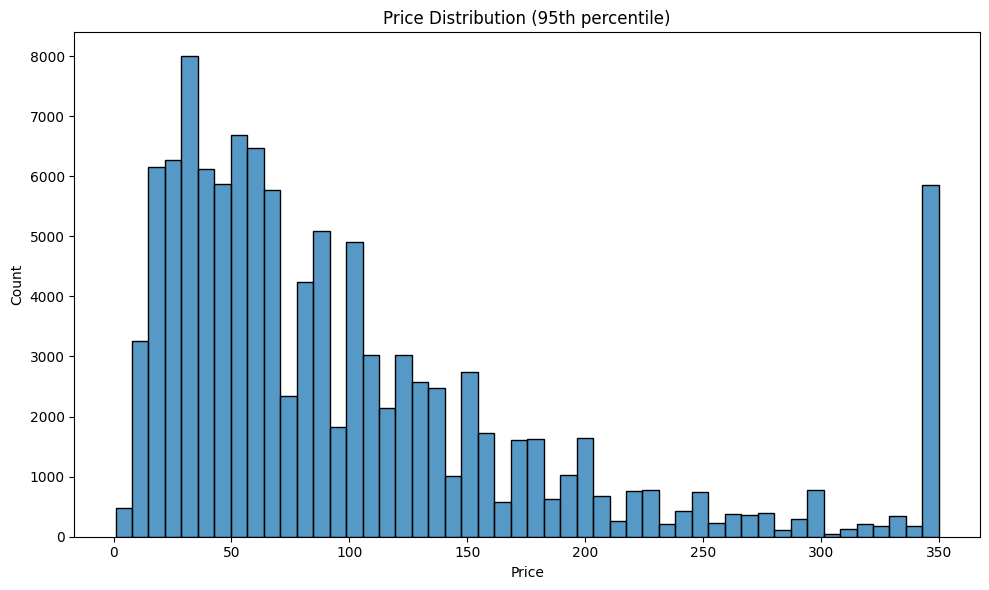
There were also 10225 product-order combinations that were duplicates and were therefore removed, duplicate data allows a single data entry to have several times the training impact that it should have.
Categorical features such as product_category_name_english, customer_state, seller_state and payment_type had missing values that were imputed with "unknown" values rather than dropping the entire feature,
this preserves the data volume while not letting missing value affect the results.
Categorical features were also converted to numerical represented ones that are more appropriate for mathematical machine models through label encoding.
Most features were determined to be non-predictive and were either merged with other features to create something with predictive power or in most cases simply dropped,
out of 52 columns the training only happened with 16 features, engineered or otherwise.
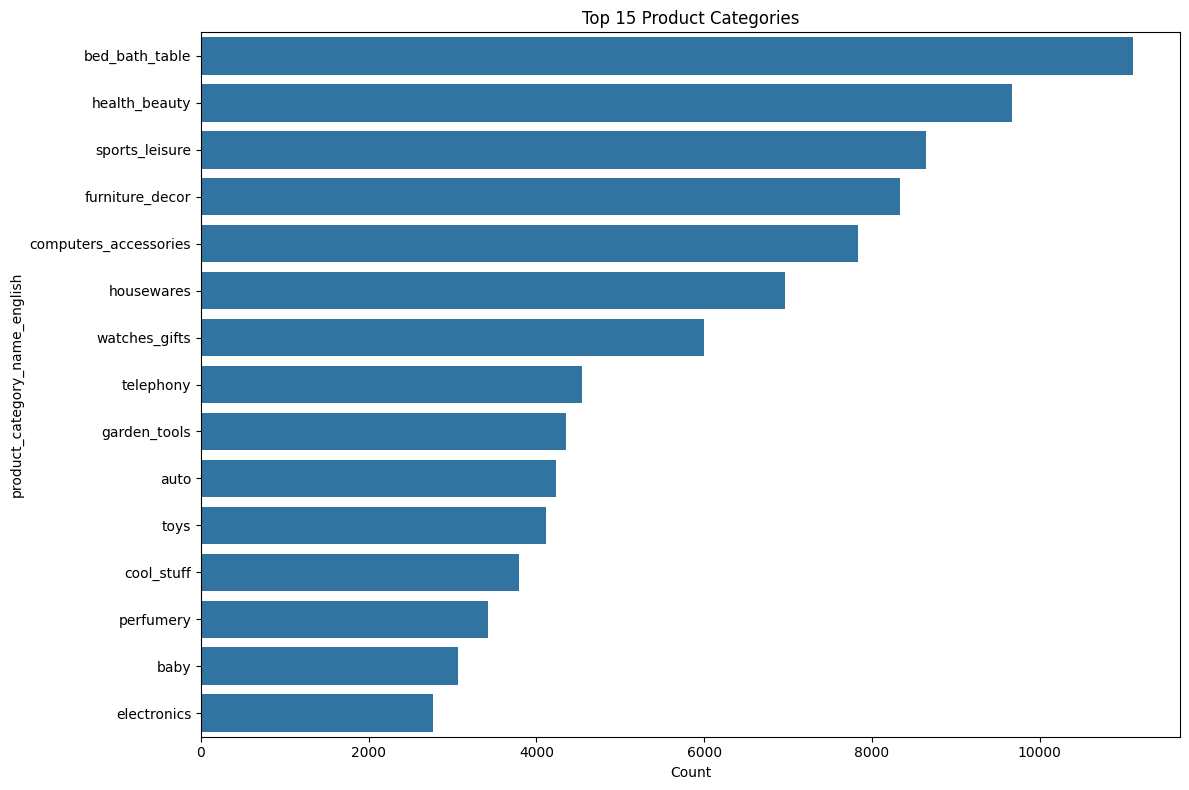
An Exploratory Data Analysis or EDA was performed and there were some interesting findings.
Firstly there was significant variation in pricing that was based on product categories, in particular electronics and furniture commanded higher prices than other categories.
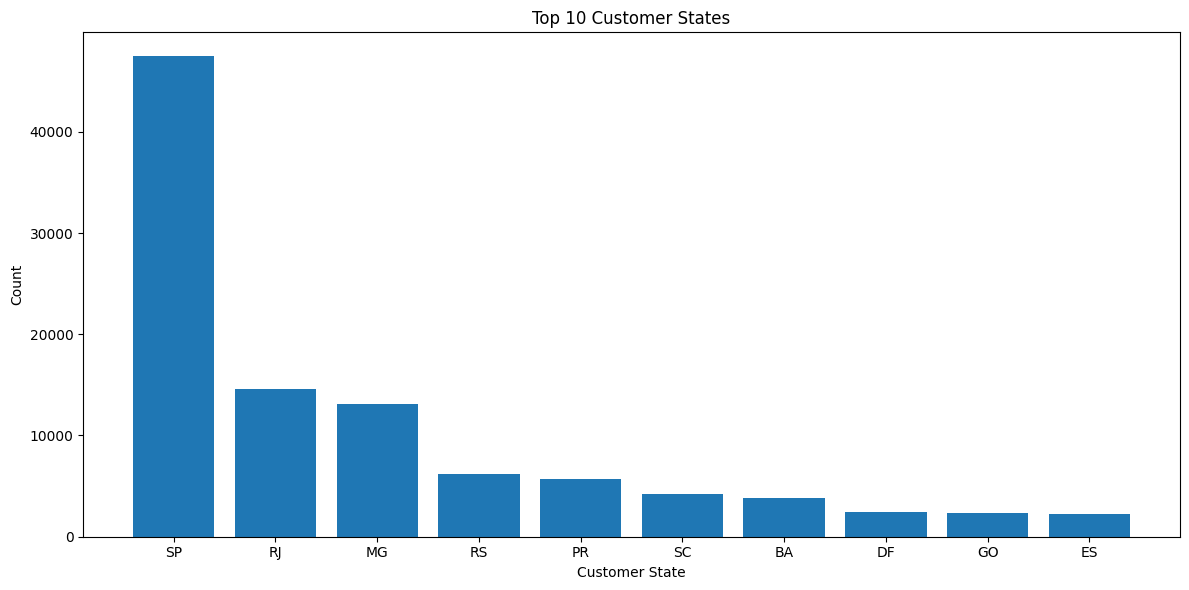
Geographic analysis revealed that certain regions such as São Paulo and Rio de Janeiro were more represented than others.
Feature importance analysis showed that there are significant relationships between price and the volume and weight of the cargo.
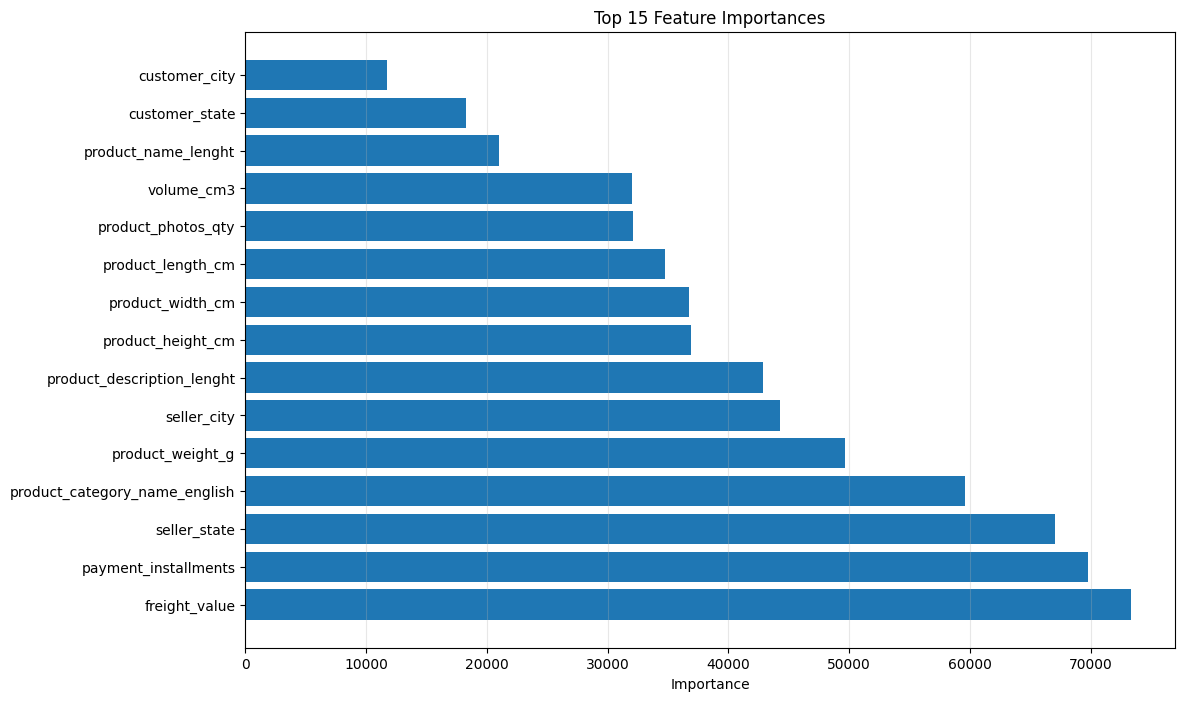
Feature engineering was employed to merge features together to create better correlations. An example is the creation of a volume feature that combined the length, height and width of a product. The volume feature turned out to be highly correlated to price.
There were also some features that were clear examples of data leaks such as payment amount which will obviously be very highly correlated with the product price, the difference only consisting of shipment costs, these were removed.
Four models were employed, a decision tree, random forest, XGBoost and a neutral network.
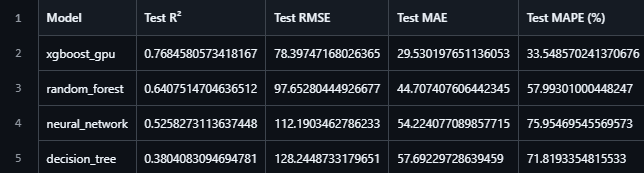
Decision Tree:

Random Forest:

Neural Network:


XGBoost:


XGBoost had the best accuracy at 76.8%. This model acquired a result of 58% before tuning because it would take too long to train it properly on a CPU, so computation was switched to a GPU and amount of rounds were increased which gave a better accuracy.
XGBoost's inbuilt cross-validation was also used in order to get several samplings of the data to make sure that the accuracy would be fairly consistent across different parts of the dataset.
The results imply decision tree is too simple of a model for such a vast dataset with intricately linked and complex features. Ensemble approaches such as gradient boosting and random forest works better for this type of data because they can split up the
training workload into multiple trees, the average of these trees can lead to an analysis that will yield a better result than simply doing hard binary split in each node like decision trees do since this reduces variance and overfitting. Neural networks also did decently since there were a lot of non-linear patterns that could be recognized, however neural networks struggle with tabular data and prefer unstructured datasets.
Other metrics such as RMSE, MAE and MAPE were roughly in line with the accuracy so there doesn't seem to be anything unusual about them.
In conclusion I believe that the biggest takeaway from this report is that sometimes results are limited by hardware rather than something being wrong with the model and that you need to give very complex and large datasets enough computational
power such as with a GPU to make the training meaningful. I believe I could have tried to improve and tune the random forest model more and it is possible it could do as well as the gradient boosting method however I mostly focused on gradient boosting since it gave
me the best results when I was solely using my local PC's CPU computation. I also learned that deep learning models don't work as well as I thought they would on tabulated data but prefer unstructured data which is something I will consider when choosing models in the future.
[1]Olist. (n.d.). Brazilian E-Commerce Public Dataset by Olist [Data set]. Kaggle. https://www.kaggle.com/datasets/olistbr/brazilian-ecommerce
Claude 3.7 helped in answering some questions I had, commenting the code and with troubleshooting