https://github.com/amintoorchi/dockerized-grafana-nodeexporter-prometheus
Best Monitoring System With Grafana (for visualitions), Prometheus (For Monitoring), Node_Exporter (for system metrics)
https://github.com/amintoorchi/dockerized-grafana-nodeexporter-prometheus
docker docker-compose dockeriz grafana monitoring monitoring-automation monitoring-tool nodeexporter prometheus
Last synced: 9 months ago
JSON representation
Best Monitoring System With Grafana (for visualitions), Prometheus (For Monitoring), Node_Exporter (for system metrics)
- Host: GitHub
- URL: https://github.com/amintoorchi/dockerized-grafana-nodeexporter-prometheus
- Owner: amintoorchi
- Created: 2025-10-06T13:15:53.000Z (9 months ago)
- Default Branch: main
- Last Pushed: 2025-10-06T15:20:16.000Z (9 months ago)
- Last Synced: 2025-10-06T17:24:30.657Z (9 months ago)
- Topics: docker, docker-compose, dockeriz, grafana, monitoring, monitoring-automation, monitoring-tool, nodeexporter, prometheus
- Homepage: https://xdevteam.ir
- Size: 2.93 KB
- Stars: 2
- Watchers: 0
- Forks: 2
- Open Issues: 0
-
Metadata Files:
- Readme: README.md
Awesome Lists containing this project
README
# 📊 Prometheus, Node Exporter, and Grafana Dockerized
A powerful, Dockerized monitoring stack featuring **Prometheus**, **Node Exporter**, and **Grafana**. This project simplifies deployment and provides beautiful visualizationsfor system metrics.
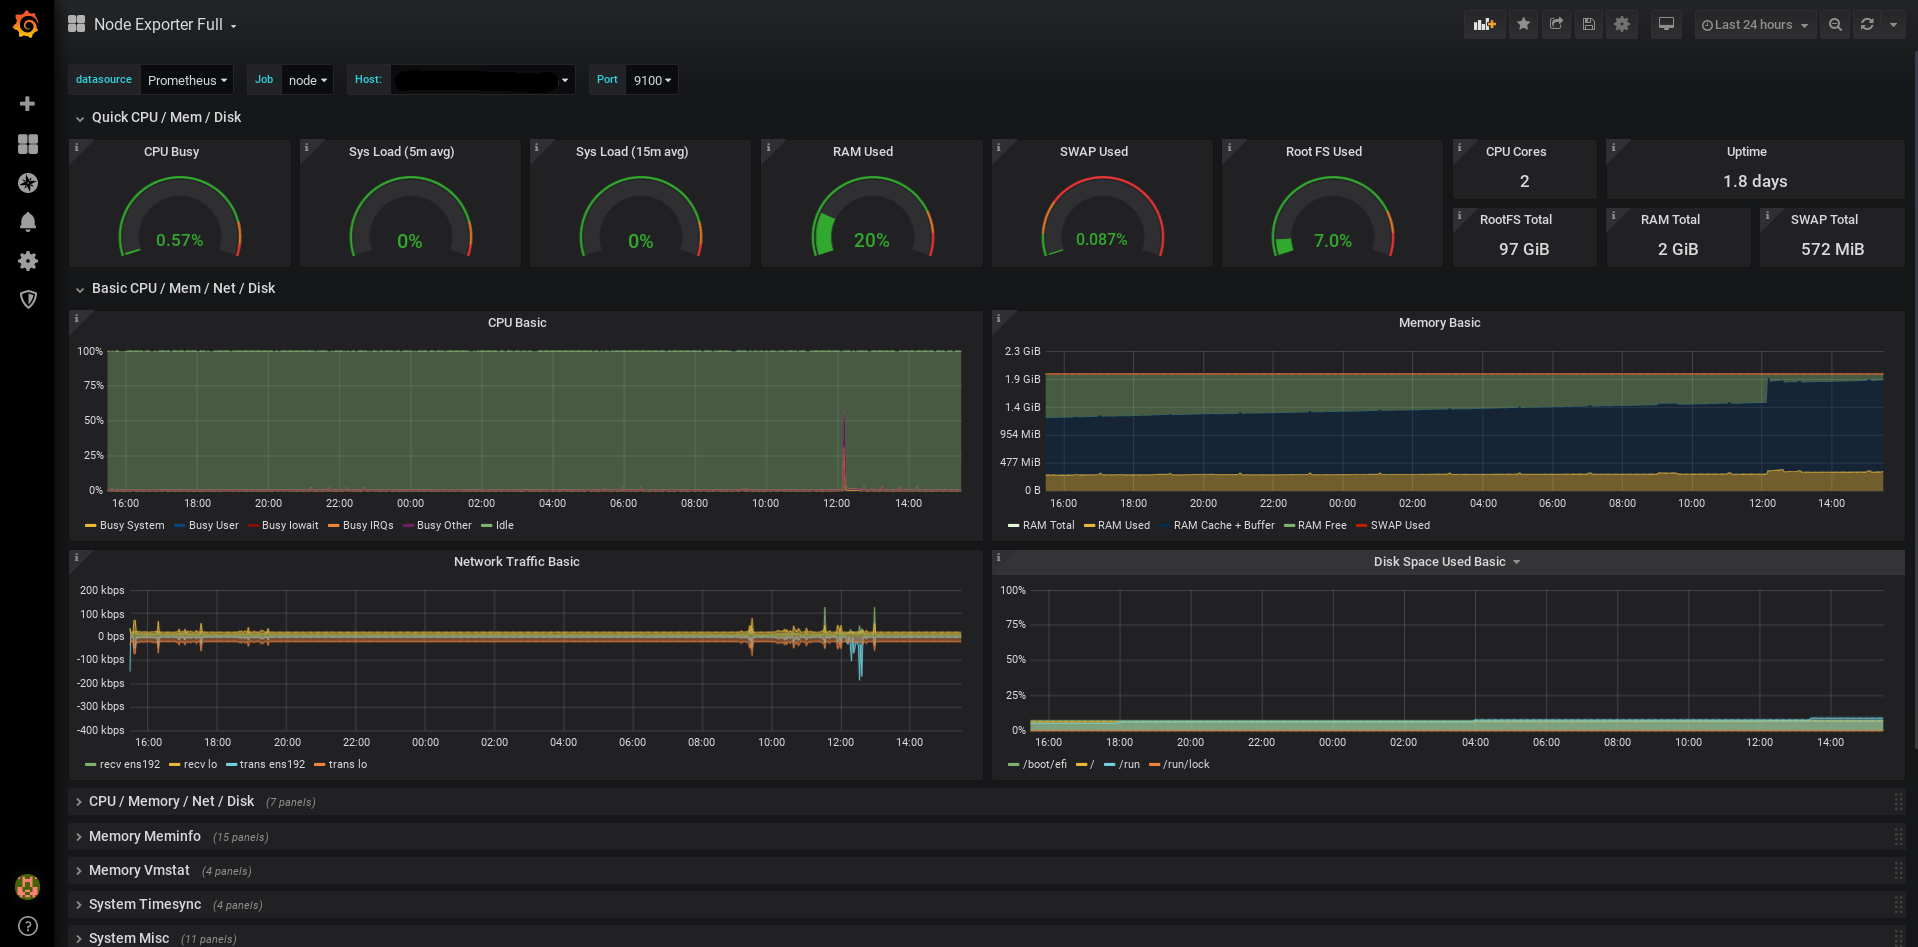
## 📸 Dashboard Preview
---
## ✨ Features
- **Prometheus**: Efficiently collects and stores system metrics.
- **Node Exporter**: Exposes detailed hardware and OS metrics from your host.
- **Grafana**: Creates stunning, customizable dashboards for data visualization.
- **Persistent Storage**: Safely stores Prometheus and Grafana data.
- **Docker Compose**: Enables quick setup with a single command.
---
### 📋 Prerequisites
Ensure the following are installed on your system:
- **Docker** (latest version recommended)
- **Docker Compose** (version 3.8 or higher)
---
## 🚀 Installation !
Follow these steps to deploy the monitoring stack:
### 1. Clone the Repository
```bash
git clone https://github.com/amintoorchi/Dockerized-Grafana-NodeExporter-Prometheus.git
cd Dockerized-Grafana-NodeExporter-Prometheus
```
### 2. Launch the Services
Start the containers in detached mode:
```bash
docker compose up -d
sudo chown -R 65534:65534 ./prom_data
sudo chmod -R 775 ./prom_data
```
### 3. Access the Services
- **Prometheus**: [http://localhost:9090](http://localhost:9090)
- **Grafana**: [http://localhost:3000](http://localhost:3000)
*Default credentials*: `admin` / `admin` (update password after first login)
---
## 🛠️ Configuration
- **Docker Compose**: The `docker-compose.yml` is pre-configured. Customize ports or volumes as needed.
- **Grafana Dashboards**: Import pre-existing dashboards or create custom ones after logging in.
- **Storage**:
- Prometheus data is stored in `./prom_data/`.
- Grafana configurations are saved in `./grafana-storage/`.
- Both directories are auto-created on first run and listed in `.gitignore`.
> **Note**: Add `./prom_data` and `./grafana-storage` to `.gitignore` to prevent uploading sensitive data to GitHub.
### Network Configuration
- **Host Network Mode**: Used by Node Exporter and Prometheus for direct access to host metrics.
- **Portability**: Switch to a `bridge` network in `docker-compose.yml` for cross-system compatibility.
---
### Troubleshooting
Resolve issues with these steps:
- **View Logs**: Check container logs for errors:
```bash:disable-run
docker compose logs
```
- **Port Conflicts**: Ensure ports `9090` (Prometheus) and `3000` (Grafana) are available.
- **Storage Permissions**: Verify that `./prom_data` and `./grafana-storage` have proper permissions.
---
### 🧭 Ready-to-use Grafana Dashboard
If you need a pre-built Grafana dashboard, you can use this beautiful and fully featured **Node Exporter Full** dashboard:
👉 [Grafana Dashboard #1860](https://grafana.com/grafana/dashboards/1860-node-exporter-full/)
---
## Contributing
We welcome contributions to improve this project! To get started:
1. Fork the repository.
2. Create a feature or bug-fix branch:
```bash
git checkout -b feature/your-feature-name
```
3. Commit your changes and push to your fork.
4. Submit a pull request with a detailed description of your updates.
---
### License
This project is licensed under the **MIT License**. See the [LICENSE](LICENSE) file for more details.
---
### 🌟 Acknowledgments
- Built with ❤️ by Amin Toorchi
- Gratitude to the open-source community for their incredible tools and resources.
```