https://github.com/anas436/data-visualization-with-python
https://github.com/anas436/data-visualization-with-python
jupyterlab matplotlib matplotlib-pyplot numpy pandas python3
Last synced: 10 months ago
JSON representation
- Host: GitHub
- URL: https://github.com/anas436/data-visualization-with-python
- Owner: Anas436
- Created: 2022-07-15T16:45:22.000Z (almost 4 years ago)
- Default Branch: main
- Last Pushed: 2022-07-15T16:51:40.000Z (almost 4 years ago)
- Last Synced: 2025-02-01T15:30:58.110Z (over 1 year ago)
- Topics: jupyterlab, matplotlib, matplotlib-pyplot, numpy, pandas, python3
- Language: Jupyter Notebook
- Homepage:
- Size: 431 KB
- Stars: 1
- Watchers: 2
- Forks: 0
- Open Issues: 0
-
Metadata Files:
- Readme: README.md
Awesome Lists containing this project
README
# Data-Visualization-with-Python
**After completing this lab you will be able to:**
* Create Data Visualization with Python.
* Use various Python libraries for visualization.
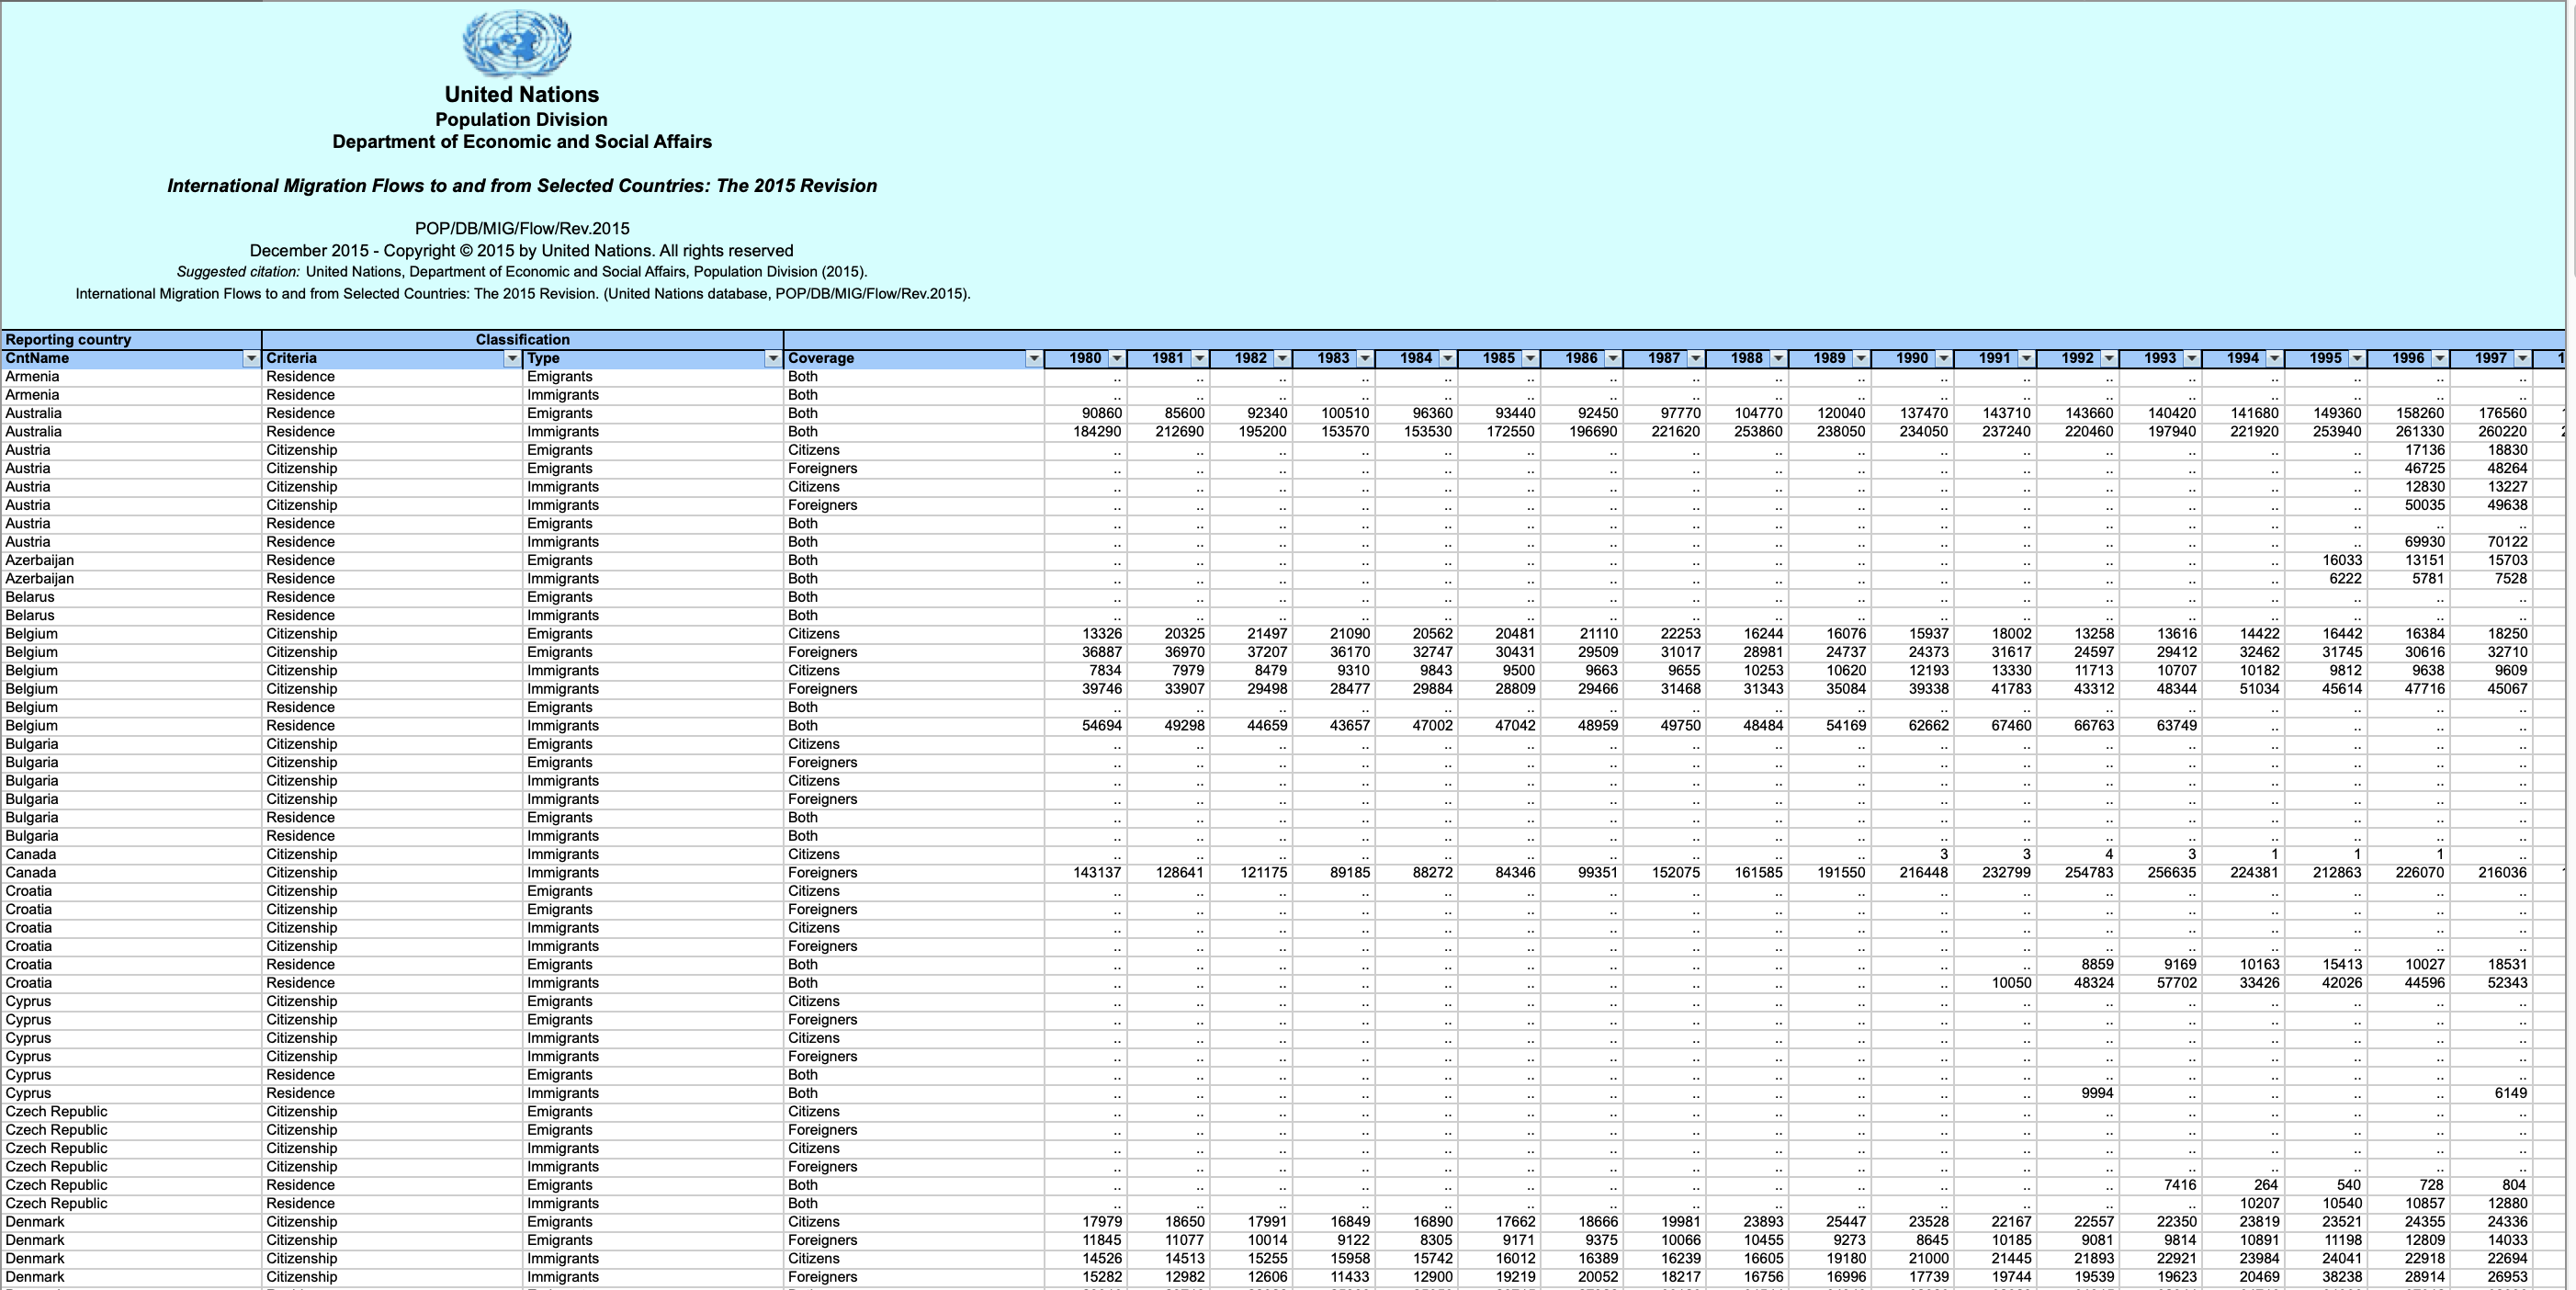
## The Dataset: Immigration to Canada from 1980 to 2013
Dataset Source: [International migration flows to and from selected countries - The 2015 revision](http://www.un.org/en/development/desa/population/migration/data/empirical2/migrationflows.shtml?utm_medium=Exinfluencer&utm_source=Exinfluencer&utm_content=000026UJ&utm_term=10006555&utm_id=NA-SkillsNetwork-Channel-SkillsNetworkCoursesIBMDeveloperSkillsNetworkDV0101ENSkillsNetwork20297740-2022-01-01).
The dataset contains annual data on the flows of international immigrants as recorded by the countries of destination. The data presents both inflows and outflows according to the place of birth, citizenship or place of previous / next residence both for foreigners and nationals. The current version presents data pertaining to 45 countries.
In this lab, we will focus on the Canadian immigration data.
The Canada Immigration dataset can be fetched from here.
***