https://github.com/ancientlore/kubismus
Embed a status page based on Cubism in your go project.
https://github.com/ancientlore/kubismus
cubism golang graphs metrics monitor
Last synced: about 1 year ago
JSON representation
Embed a status page based on Cubism in your go project.
- Host: GitHub
- URL: https://github.com/ancientlore/kubismus
- Owner: ancientlore
- License: other
- Created: 2014-09-04T02:45:02.000Z (almost 12 years ago)
- Default Branch: master
- Last Pushed: 2023-02-04T17:07:40.000Z (over 3 years ago)
- Last Synced: 2025-04-09T10:33:51.817Z (about 1 year ago)
- Topics: cubism, golang, graphs, metrics, monitor
- Language: Go
- Size: 731 KB
- Stars: 4
- Watchers: 2
- Forks: 1
- Open Issues: 0
-
Metadata Files:
- Readme: README.md
- License: LICENSE
Awesome Lists containing this project
README
 kubismus
====================================================================================================
[](https://pkg.go.dev/github.com/ancientlore/kubismus)
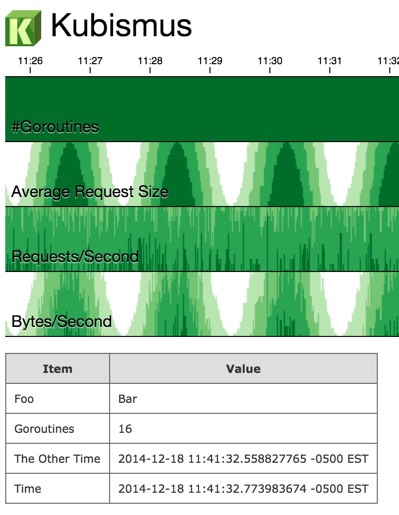
Kubismus is a [go](http://golang.org/) package that makes it easy to display status metrics using [Cubism.js](https://square.github.io/cubism/). ("Kubismus" is the German word for "cubism".)
Checkout the sample code: [ktest.go](https://gist.github.com/ancientlore/7802445bba933a2c85a8)
Screen Shot
-----------
Defining the HTTP Handler
-------------------------
To get started with all defaults, simply register the HTTP handler and serve HTTP:
kubismus.HandleHTTP()
go http.ListenAndServe(":8080", nil)
This creates an endpoint at http://localhost:8080/kubismus that will register information you log.
If you need a custom endpoint, use `kubismus.ServeHTTP` directly:
http.Handle("/", http.HandlerFunc(kubismus.ServeHTTP))
Adding Data
-----------
Kubismus shows graphs and a table of data. You can add entries to these at any time. To add an entry to the table that shows the number of goroutines:
kubismus.Note("Goroutines", fmt.Sprintf("%d", runtime.NumGoroutine()))
To add an entry to a graph:
kubismus.Metric("Metric Name", count, value)
By default, each metric has a count, average, and sum graph. To configure which graphs to show, use the `Define` method:
kubismus.Define("Posts", kubismus.COUNT, "HTTP Posts")
kubismus.Define("Posts", kubismus.SUM, "Bytes Posted")
Adding metrics and table entries use channels and are thread-safe. Graphs for new metrics may not appear until a browser refresh.
Customizing the Title
---------------------
You can configure the status page's icon and title:
kubismus.Setup("My Cool Utility", "/web/kubismus36.png")