https://github.com/andrewtavis/poli-sci-kit
Political elections, appointment, analysis and visualization in Python
https://github.com/andrewtavis/poli-sci-kit
analysis appointment democracy disproportionality elections open-source political-appointment-analysis political-science politics python python3 statistics visualization voting
Last synced: over 1 year ago
JSON representation
Political elections, appointment, analysis and visualization in Python
- Host: GitHub
- URL: https://github.com/andrewtavis/poli-sci-kit
- Owner: andrewtavis
- License: bsd-3-clause
- Created: 2020-05-12T17:16:50.000Z (about 6 years ago)
- Default Branch: main
- Last Pushed: 2024-02-04T10:55:35.000Z (over 2 years ago)
- Last Synced: 2025-03-22T17:41:55.261Z (over 1 year ago)
- Topics: analysis, appointment, democracy, disproportionality, elections, open-source, political-appointment-analysis, political-science, politics, python, python3, statistics, visualization, voting
- Language: Python
- Homepage:
- Size: 4.43 MB
- Stars: 30
- Watchers: 3
- Forks: 6
- Open Issues: 3
-
Metadata Files:
- Readme: README.md
- Changelog: CHANGELOG.md
- Contributing: CONTRIBUTING.md
- License: LICENSE.txt
- Code of conduct: .github/CODE_OF_CONDUCT.md
Awesome Lists containing this project
README

[](http://poli-sci-kit.readthedocs.io/en/latest/)
[](https://github.com/andrewtavis/poli-sci-kit/actions?query=workflow%3ACI)
[](https://codecov.io/gh/andrewtavis/poli-sci-kit)
[](https://pypi.org/project/poli-sci-kit/)
[](https://pypi.org/project/poli-sci-kit/)
[](https://pypi.org/project/poli-sci-kit/)
[](https://github.com/andrewtavis/poli-sci-kit/blob/main/LICENSE.txt)
[](https://github.com/andrewtavis/poli-sci-kit/blob/main/.github/CODE_OF_CONDUCT.md)
[](https://github.com/psf/black)
[](https://colab.research.google.com/github/andrewtavis/poli-sci-kit)
## Political elections, appointment, analysis and visualization in Python
**poli-sci-kit** is a Python package for political science appointment and election analysis. The goal is to provide a comprehensive tool for all methods needed to analyze and simulate election results. See the [documentation](https://poli-sci-kit.readthedocs.io/en/latest/) for a full outline of the package including algorithms and visualization techniques.
# **Contents**
- [Installation](#installation)
- [Appointment](#appointment)
- [Plotting](#plotting)
- [Parliament Plots](#parliament-plots)
- [Disproportionality Bar Plot](#disproportionality-bar-plot)
- [Examples](#examples)
- [To-Do](#to-do)
# Installation [`⇧`](#contents)
poli-sci-kit can be downloaded from PyPI via pip or sourced directly from this repository:
```bash
pip install poli-sci-kit
```
```bash
git clone https://github.com/andrewtavis/poli-sci-kit.git
cd poli-sci-kit
python setup.py install
```
```python
import poli_sci_kit
```
# Appointment [`⇧`](#contents)
[appointment.methods](https://github.com/andrewtavis/poli-sci-kit/blob/main/src/poli_sci_kit/appointment/methods.py) includes functions to allocate parliamentary seats based on population or vote shares. Included methods are:
#### Largest Remainder: Hare, Droop, Hagenbach–Bischoff (incl Hamilton, Vinton, Hare–Niemeyer)
#### Highest Averages: Jefferson, Webster, Huntington-Hill
Arguments to allow allocation thresholds, minimum allocations per group, tie break conditions, and other election features are also provided. Along with deriving results for visualization and reporting, these functions allow the user to analyze outcomes given systematic or situational changes. The [appointment.metrics](https://github.com/andrewtavis/poli-sci-kit/blob/main/src/poli_sci_kit/appointment/metrics.py) module further provides diagnostics to analyze the results of elections, apportionments, and other political science scenarios.
A basic example of political appointment using poli-sci-kit is:
```python
from poli_sci_kit import appointment
vote_counts = [2700, 900, 3300, 1300, 2150, 500]
seats_to_allocate = 50
# Huntington-Hill is the method used to allocate House of Representatives seats to US states
ha_allocations = appointment.methods.highest_averages(
averaging_style="Huntington-Hill",
shares=vote_counts,
total_alloc=seats_to_allocate,
alloc_threshold=None,
min_alloc=1,
tie_break="majority",
majority_bonus=False,
modifier=None,
)
ha_allocations
# [26, 9, 37, 12, 23, 5]
```
We can then compute various metrics to derive disproportionality:
```python
# The Gallagher method is a measure of absolute difference similar to summing square residuals
disproportionality = appointment.metrics.dispr_index(
shares=vote_counts,
allocations=ha_allocations,
metric_type='Gallagher'
)
disproportionality
# 0.01002
```
We can also check that the allocations pass the [quota condition](https://en.wikipedia.org/wiki/Quota_rule):
```python
passes_qc = appointment.checks.quota_condition(
shares=vote_counts,
seats=ha_allocations
)
passes_qc
# True
```
Allocation consistency can further be checked using dataframes of shares and seats given electoral settings. See [appointment.checks](https://github.com/andrewtavis/poli-sci-kit/blob/main/src/poli_sci_kit/appointment/checks.py) and [the documentation](https://poli-sci-kit.readthedocs.io/en/latest/) for explanations of method checks.
# Plotting [`⇧`](#contents)
poli-sci-kit provides Python only implementations of common electoral plots.
Visualizing the above results:
```python
import matplotlib.pyplot as plt
import poli_sci_kit
# German political parties
parties = ['CDU/CSU', 'FDP', 'Greens', 'Die Linke', 'SPD', 'AfD']
party_colors = ['#000000', '#ffed00', '#64a12d', '#be3075', '#eb001f', '#009ee0']
```
### Parliament Plots [`⇧`](#contents)
poli_sci_kit provides implementations of both rectangular and semicircle [parliament plots](https://github.com/andrewtavis/poli-sci-kit/blob/main/src/poli_sci_kit/plot/parliament.py):
```python
fig, (ax1, ax2) = plt.subplots(nrows=1, ncols=2)
ax1 = poli_sci_kit.plot.parliament(
allocations=seat_allocations,
labels=parties,
colors=party_colors,
style="rectangle",
num_rows=4,
marker_size=300,
speaker=True,
axis=ax1,
)
ax2 = poli_sci_kit.plot.parliament(
allocations=seat_allocations,
labels=parties,
colors=party_colors,
style="semicircle",
num_rows=4,
marker_size=175,
speaker=False,
axis=ax2,
)
plt.show()
```


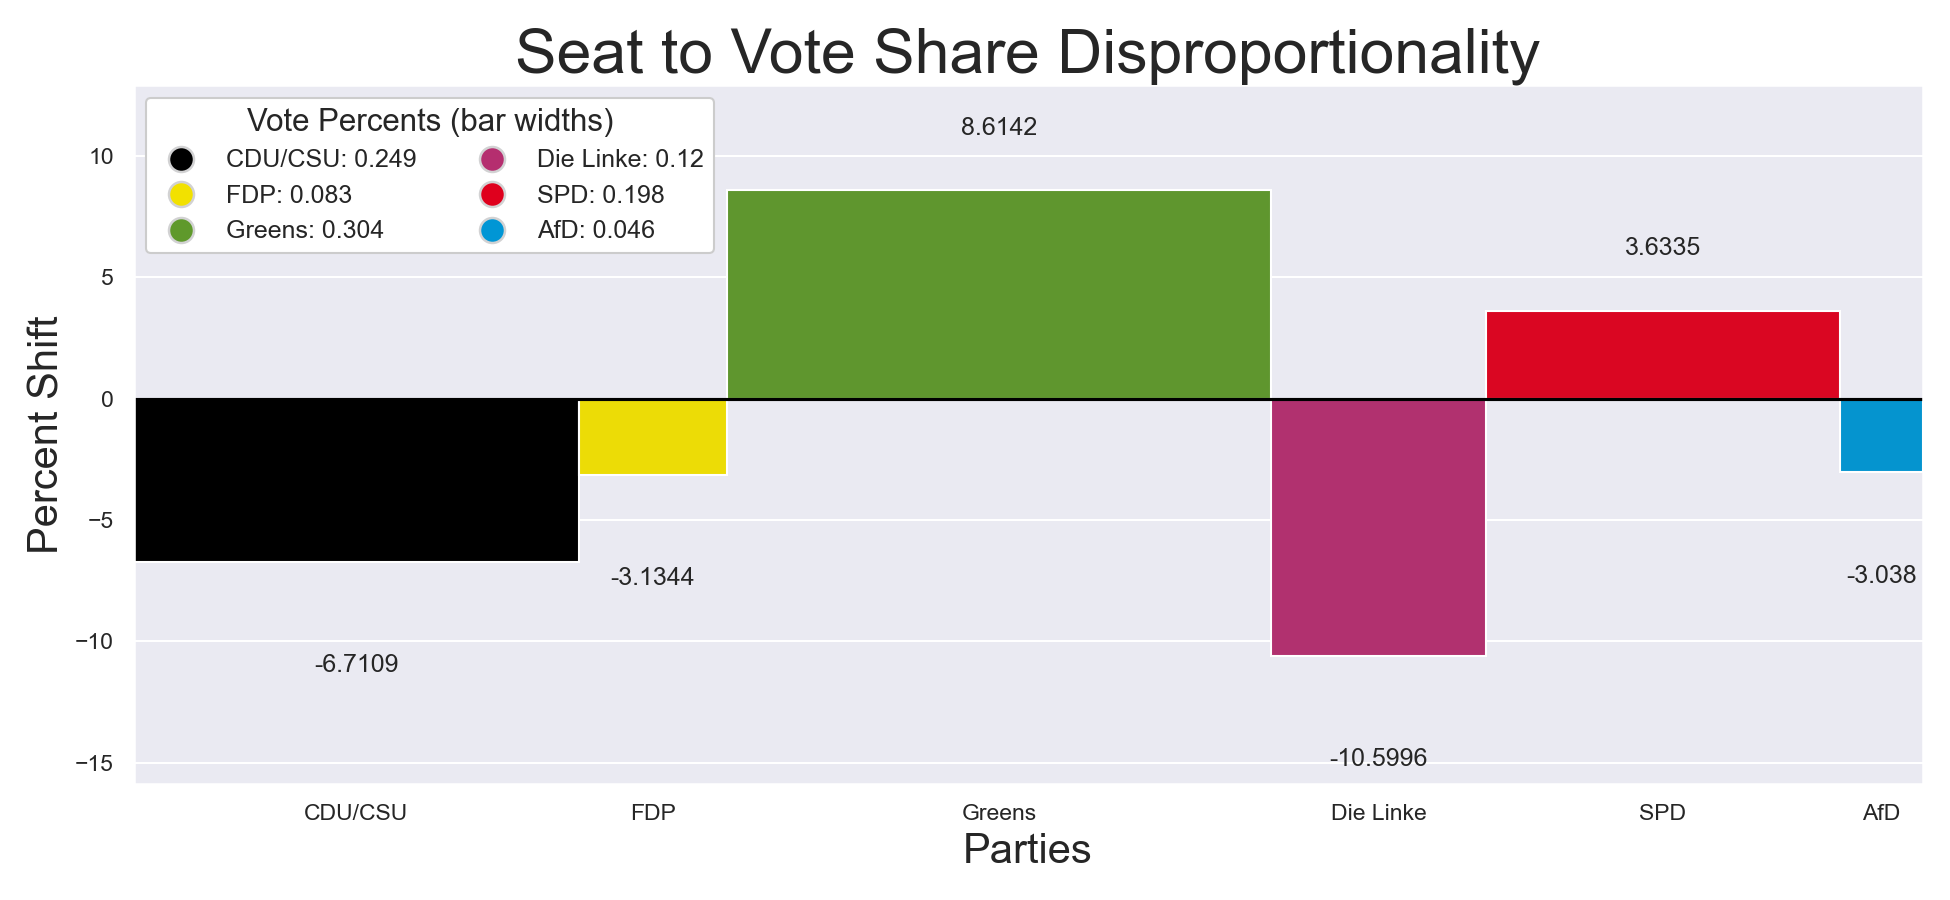
### Disproportionality Bar Plot [`⇧`](#contents)
A novel addition to social science analysis is the [disproportionality bar plot](https://github.com/andrewtavis/poli-sci-kit/blob/main/src/poli_sci_kit/plot/dispr_bar.py), which graphically depicts the disproportionality between expected and realized results. Bar widths are the proportion of shares (ex: votes received), and heights are the difference or relative difference between shares and allocations (ex: parliament seats received).
An example follows:
```python
import pltviz
ax = poli_sci_kit.plot.dispr_bar(
shares=votes,
allocations=ha_allocations,
labels=parties,
colors=party_colors,
total_shares=None,
total_alloc=None,
percent=True,
axis=None,
)
handles, labels = pltviz.plot.legend.gen_elements(
counts=[round(v / sum(votes), 4) for v in votes],
labels=parties,
colors=party_colors,
size=11,
marker="o",
padding_indexes=None,
order=None,
)
ax.legend(
handles=handles,
labels=labels,
title="Vote Percents (bar widths)",
title_fontsize=15,
fontsize=11,
ncol=2,
loc="upper left",
bbox_to_anchor=(0, 1),
frameon=True,
facecolor="#FFFFFF",
framealpha=1,
)
ax.axes.set_title('Seat to Vote Share Disproportionality', fontsize=30)
ax.set_xlabel('Parties', fontsize=20)
ax.set_ylabel('Percent Shift', fontsize=20)
plt.show()
```
# Examples [`⇧`](#contents)
Examples in poli-sci-kit use publicly available Wikidata statistics sourced via the Python package [wikirepo](https://github.com/andrewtavis/wikirepo). Current examples include:
- [US HoR](https://github.com/andrewtavis/poli-sci-kit/blob/main/examples/us_house_of_rep.ipynb) [(Open in Colab)](https://colab.research.google.com/github/andrewtavis/poli-sci-kit/blob/main/examples/us_house_of_rep.ipynb)
- Allocates seats to a version of the US House of Representatives that includes all US territories and Washington DC given census data, with this further being used to derive relative vote strengths of state citizens in the US presidential election
- [Global Parliament](https://github.com/andrewtavis/poli-sci-kit/blob/main/examples/global_parliament.ipynb) [(Open in Colab)](https://colab.research.google.com/github/andrewtavis/poli-sci-kit/blob/main/examples/global_parliament.ipynb)
- Analyzes the allocation of seats in a hypothetical global parliament given the prevalence of certain countries and organizations, the distribution of seats based on Freedom House indexes, as well as disproportionality metrics
# To-Do [`⇧`](#contents)
Please see the [contribution guidelines](https://github.com/andrewtavis/poli-sci-kit/blob/main/.github/CONTRIBUTING.md) if you are interested in contributing to this project. Work that is in progress or could be implemented includes:
- Adding the [Adams method](https://en.wikipedia.org/wiki/Highest_averages_method) to [appointment.methods.highest_averages](https://github.com/andrewtavis/poli-sci-kit/blob/main/src/poli_sci_kit/appointment/methods.py) ([see issue](https://github.com/andrewtavis/poli-sci-kit/issues/21))
- Deriving further needed arguments to assure that all current and historic appointment systems can be simulated using poli-sci-kit ([see issue](https://github.com/andrewtavis/poli-sci-kit/issues/22))
- Potentially indexing preset versions of [appointment.methods](https://github.com/andrewtavis/poli-sci-kit/blob/main/src/poli_sci_kit/appointment/methods.py) that coincide with the systems used by governments around the world
- This would allow quick comparisons of actual systems with variations
- Adding methods such as quadratic voting to poli-sci-kit to allow for preference based simulations
- Creating, improving and sharing [examples](https://github.com/andrewtavis/poli-sci-kit/tree/main/examples)
- Improving [tests](https://github.com/andrewtavis/poli-sci-kit/tree/main/tests) for greater [code coverage](https://codecov.io/gh/andrewtavis/poli-sci-kit)
# References
Full list of references
- [voting](https://github.com/crflynn/voting) by [crflynn](https://github.com/crflynn) ([License](https://github.com/crflynn/voting/blob/master/LICENSE.txt))
- https://blogs.reading.ac.uk/readingpolitics/2015/06/29/electoral-disproportionality-what-is-it-and-how-should-we-measure-it/
- Balinski, M. L., and Young, H. P. (1982). Fair Representation: Meeting the Ideal of One Man, One Vote. New Haven, London: Yale University Press.
- Karpov, A. (2008). "Measurement of disproportionality in proportional representation systems". Mathematical and Computer Modelling, Vol. 48, pp. 1421-1438. URL: https://www.sciencedirect.com/science/article/pii/S0895717708001933.
- Kohler, U., and Zeh, J. (2012). “Apportionment methods”. The Stata Journal, Vol. 12, No. 3, pp. 375–392. URL: https://journals.sagepub.com/doi/pdf/10.1177/1536867X1201200303.
- Taagepera, R., and Grofman, B. (2003). "Mapping the Indices of Seats-Votes Disproportionality and Inter-Election Volatility". Party Politics, Vol. 9, No. 6, pp. 659–677. URL: https://escholarship.org/content/qt0m9912ff/qt0m9912ff.pdf.