Ecosyste.ms: Awesome
An open API service indexing awesome lists of open source software.
https://github.com/angelof-exe/transport-strikes-italy
In this Data Analysis and Visualization project, using the DataSet made available by the Ministry of Infrastructure and Transport, 4 graphs will be created on the problem of worker strikes transport in Italy.
https://github.com/angelof-exe/transport-strikes-italy
Last synced: about 2 months ago
JSON representation
In this Data Analysis and Visualization project, using the DataSet made available by the Ministry of Infrastructure and Transport, 4 graphs will be created on the problem of worker strikes transport in Italy.
- Host: GitHub
- URL: https://github.com/angelof-exe/transport-strikes-italy
- Owner: angelof-exe
- Created: 2023-11-19T09:48:42.000Z (about 1 year ago)
- Default Branch: main
- Last Pushed: 2023-11-20T11:37:25.000Z (about 1 year ago)
- Last Synced: 2024-02-18T18:26:26.353Z (10 months ago)
- Language: Python
- Homepage:
- Size: 1.57 MB
- Stars: 0
- Watchers: 1
- Forks: 0
- Open Issues: 0
-
Metadata Files:
- Readme: README.md
Awesome Lists containing this project
README
# Transport Strikes in Italy
In this data analysis and visualization project, using the DataSet made available by the Ministry of Infrastructure and Transport (https://dati.mit.gov.it/catalog/dataset), 4 graphs will be created on the problem of worker strikes transport in Italy, in particular:
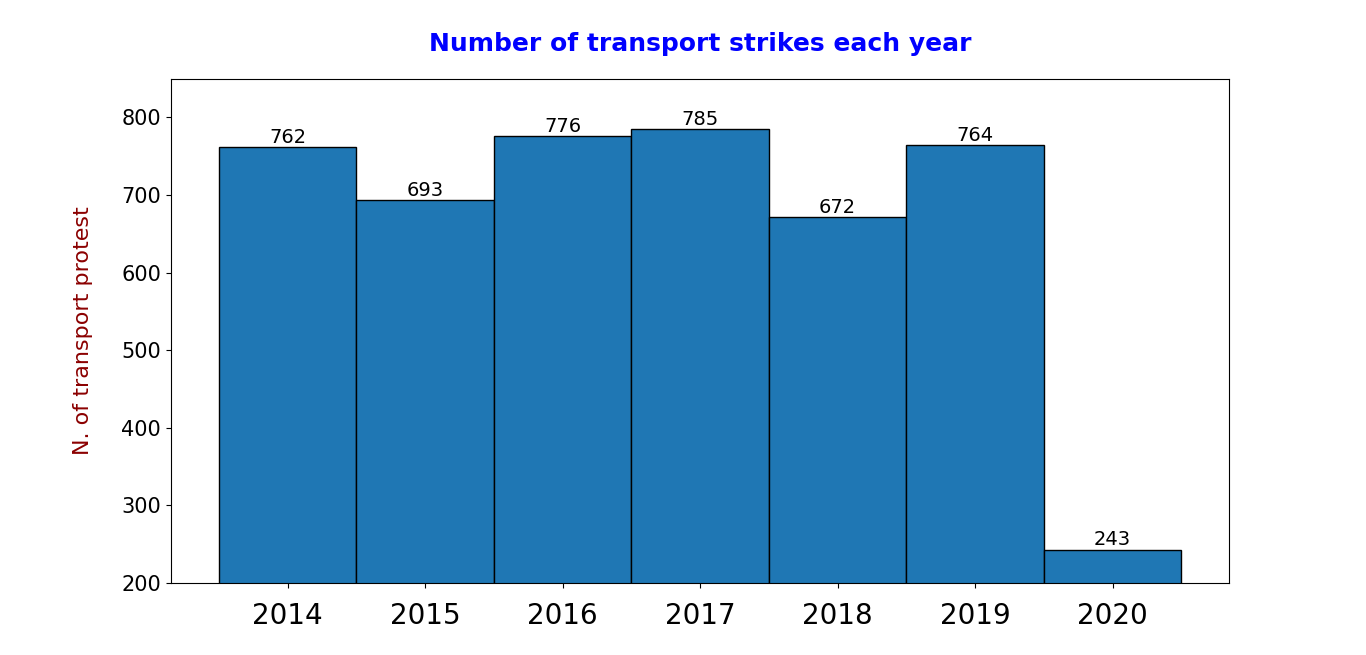
- A histogram on the number of transport strikes from 2014 to 2020
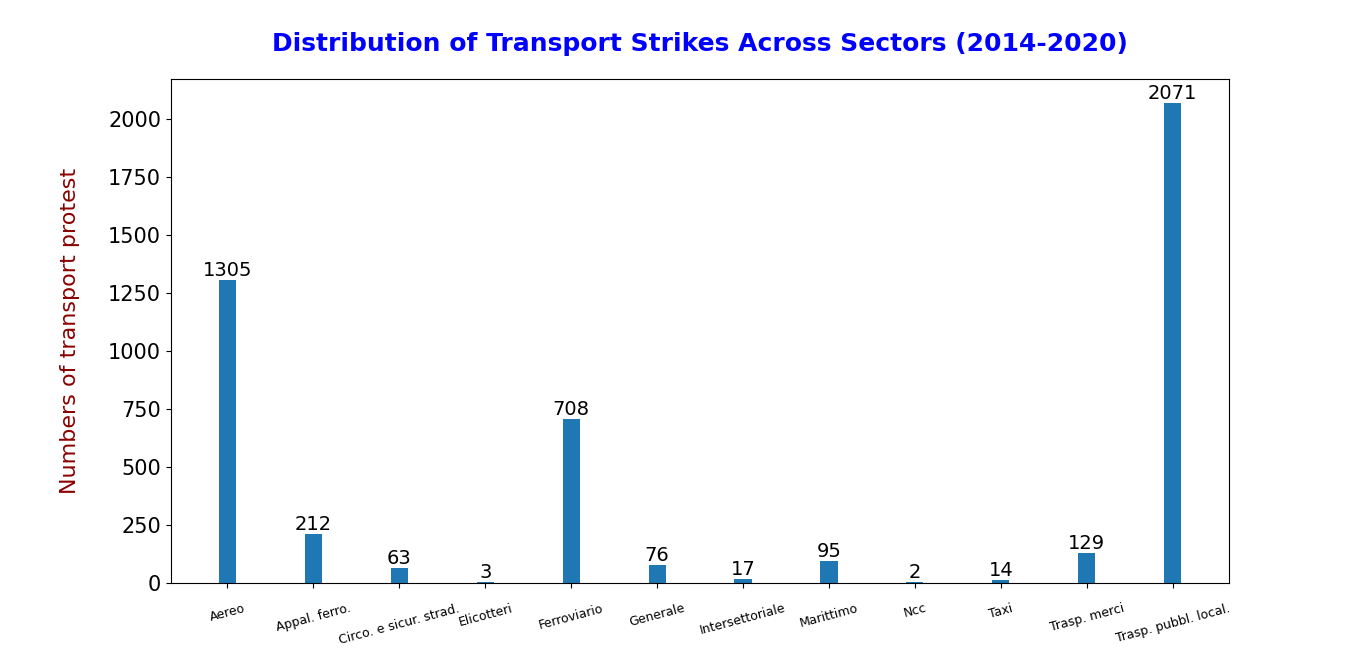
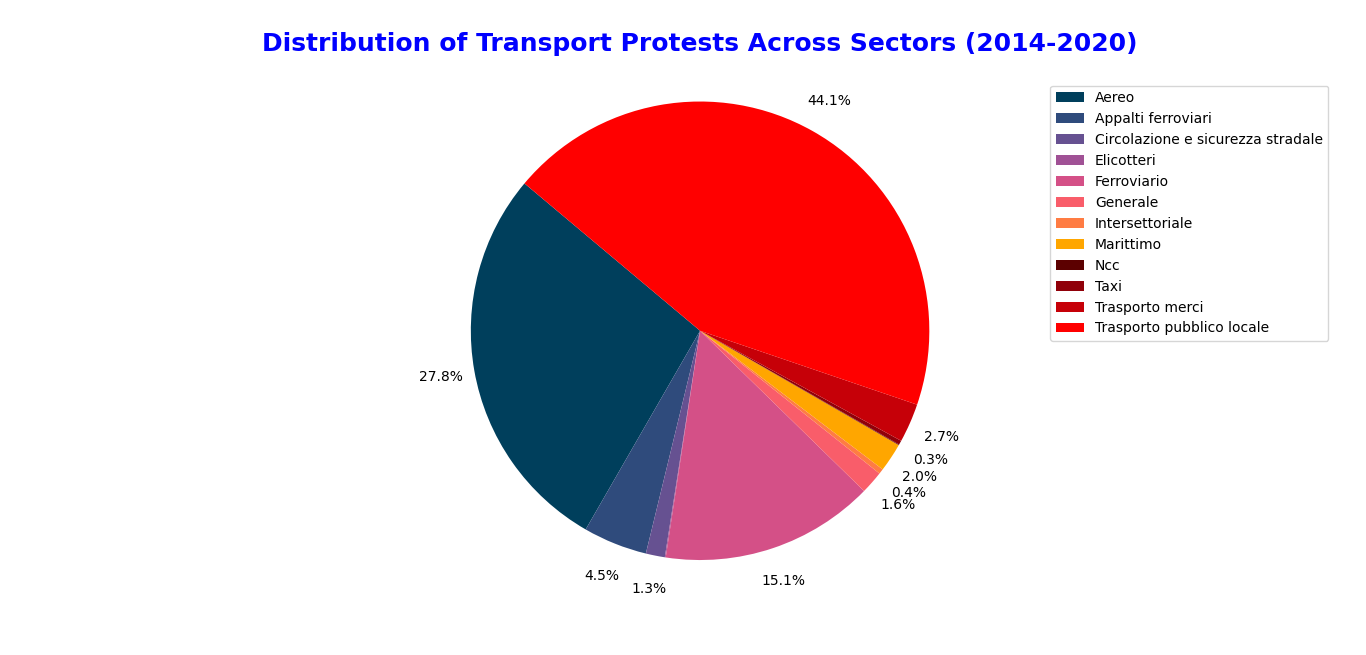
- A bar chart and pie chart on the number of sectors where strikes occurred
- Visualization of a choropleth map on the number of strikes in Italy by region
### Requirements
Install the python packages present in the `requirements.txt` file
pip3 install -r requirements.txt
## Number of transport strikes 2014-2020

The `histogram.py` file creates a histogram where the X axis is the year
while the Y axis is the number of transport strikes that occurred in that year. This python script also use the `strikes_number_per_year.py` present in the module directory.
## Transport sectors where strikes occurred


The `bar_chart.py` and `pie_chart.py` files creates the two graphs about the numbers of strikes occured in various sectors of transport. This python script also use the `strikes_number_per_sectors.py` present in the module directory.
## Strikes in Italy by region

The `choropleth_map.py` file create an choropleth map about of the number of strikes occured in every region of Italy. This python script also use the `strikes_number_by_region.py` present in the module directory.