https://github.com/animator/orange3-scoring
:tangerine: :dart: Score PMML and PFA models in Orange3
https://github.com/animator/orange3-scoring
inference inference-engine orange orange3 pfa pfa-standard pmml scoring scoring-engine
Last synced: 10 months ago
JSON representation
:tangerine: :dart: Score PMML and PFA models in Orange3
- Host: GitHub
- URL: https://github.com/animator/orange3-scoring
- Owner: animator
- License: mit
- Created: 2019-11-20T19:28:19.000Z (over 6 years ago)
- Default Branch: master
- Last Pushed: 2019-12-17T07:31:06.000Z (over 6 years ago)
- Last Synced: 2025-08-16T11:59:04.782Z (11 months ago)
- Topics: inference, inference-engine, orange, orange3, pfa, pfa-standard, pmml, scoring, scoring-engine
- Language: Python
- Homepage: https://pypi.org/project/orange3-scoring/
- Size: 651 KB
- Stars: 5
- Watchers: 1
- Forks: 1
- Open Issues: 1
-
Metadata Files:
- Readme: README.md
- License: LICENSE
Awesome Lists containing this project
README
Orange3 Scoring
======================
This is an scoring/inference add-on for [Orange3](http://orange.biolab.si). This add-on adds widgets to
load [PMML](http://dmg.org/pmml/v4-4/GeneralStructure.html) and [PFA](http://dmg.org/pfa/index.html) models
and score data.
Dependencies
------------
To use PMML models make sure you have Java installed:
- Java >= 1.8
- pypmml (downloaded during installation)
To use PFA models:
- titus2 (downloaded during installation)
Installation
------------
To install the add-on using pip, run
```
pip install orange3-scoring
```
To register this add-on with Orange, but keep the code in the development directory (do not copy it to
Python's site-packages directory), run
```
pip install -e .
```
Issues, Questions and Feature Requests
--------------------------------------
Please raise an issue/question/request [here](https://github.com/animator/orange3-scoring/issues).
Development
-----------
Want to contribute? Great!
Please raise an [issue](https://github.com/animator/orange3-scoring/issues) to discuss your ideas and send a [pull request](https://github.com/animator/orange3-scoring/pulls).
Usage
-----
After the installation, the widget from this add-on is registered with Orange. To run Orange from the terminal,
use
```
python -m Orange.canvas
```
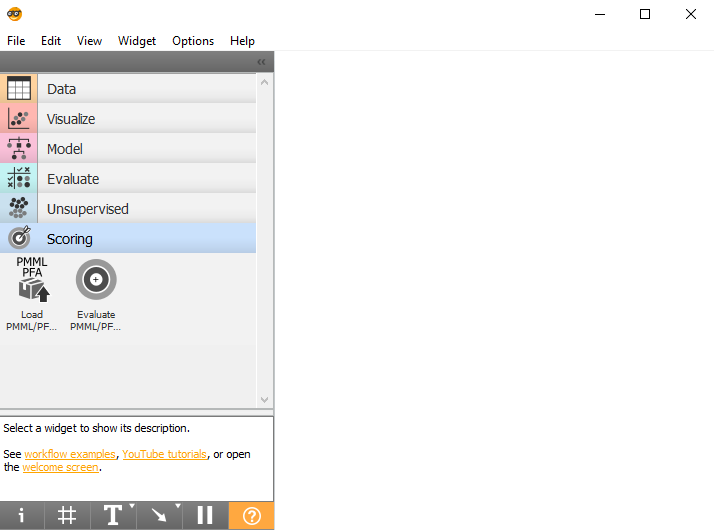
**Step 1**
The new set of widgets appear in the toolbox bar under the section `Scoring`.
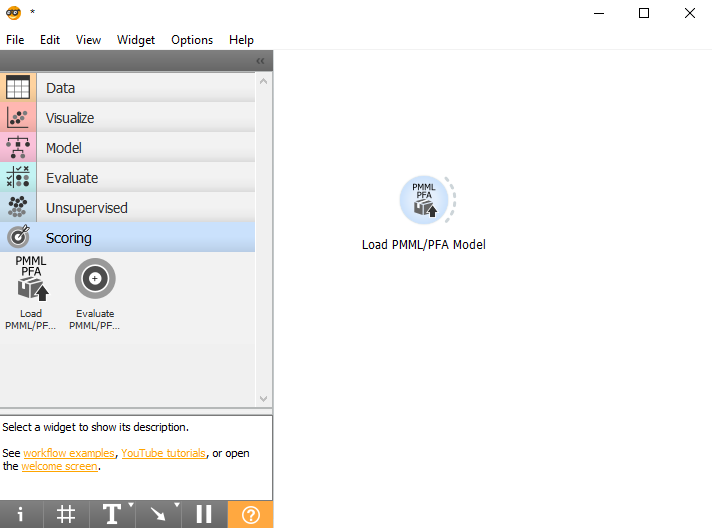
**Step 2**
Drag and drop the `Load PMML/PFA Model` widget.
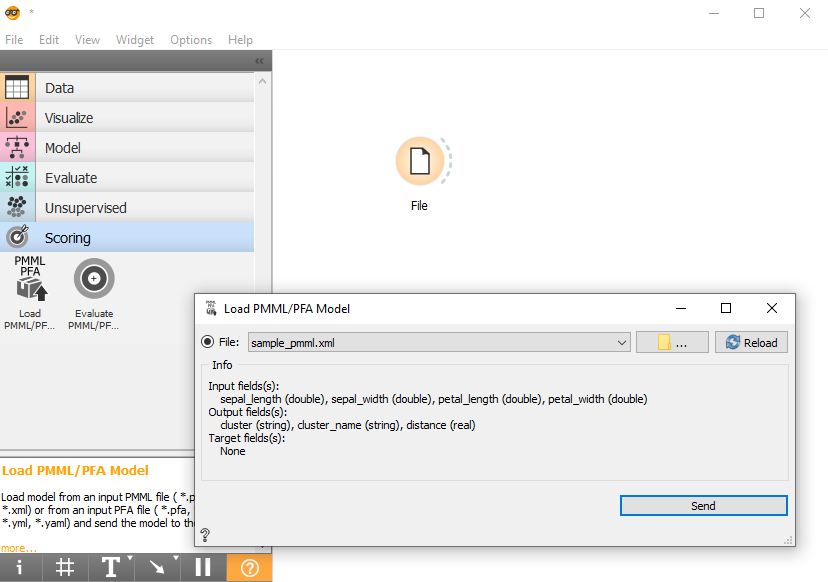
**Step 3**
Load your PMML model and inspect Input and Output field(s). Sample PMML File [here](https://github.com/animator/orange3-scoring/blob/master/orangecontrib/scoring/tests/sample_pmml.xml).
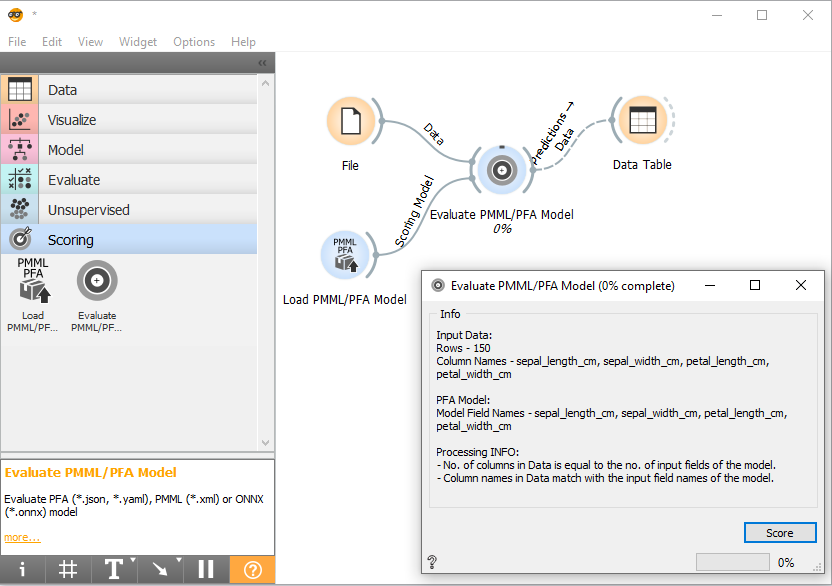
**Step 4**
Add input dataset using `File` widget (iris) and connect the two widgets to `Evaluate PMML/PFA Model` widget. You can inspect the fields in data and the model and view Processing INFO or Errors.
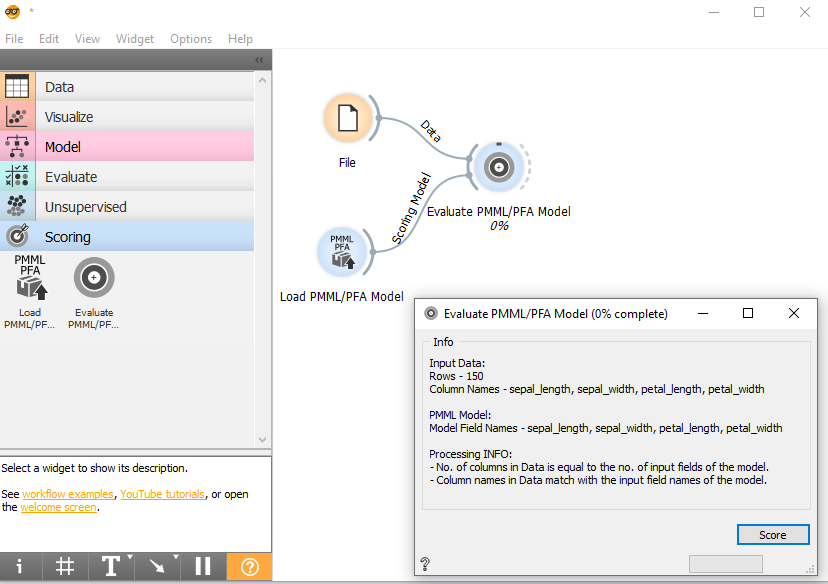
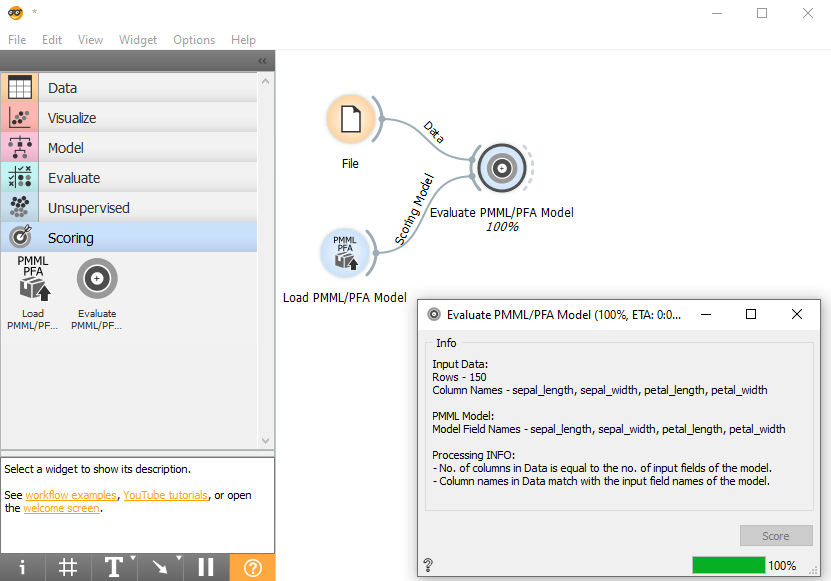
**Step 5**
Now hit `Score` button to score.
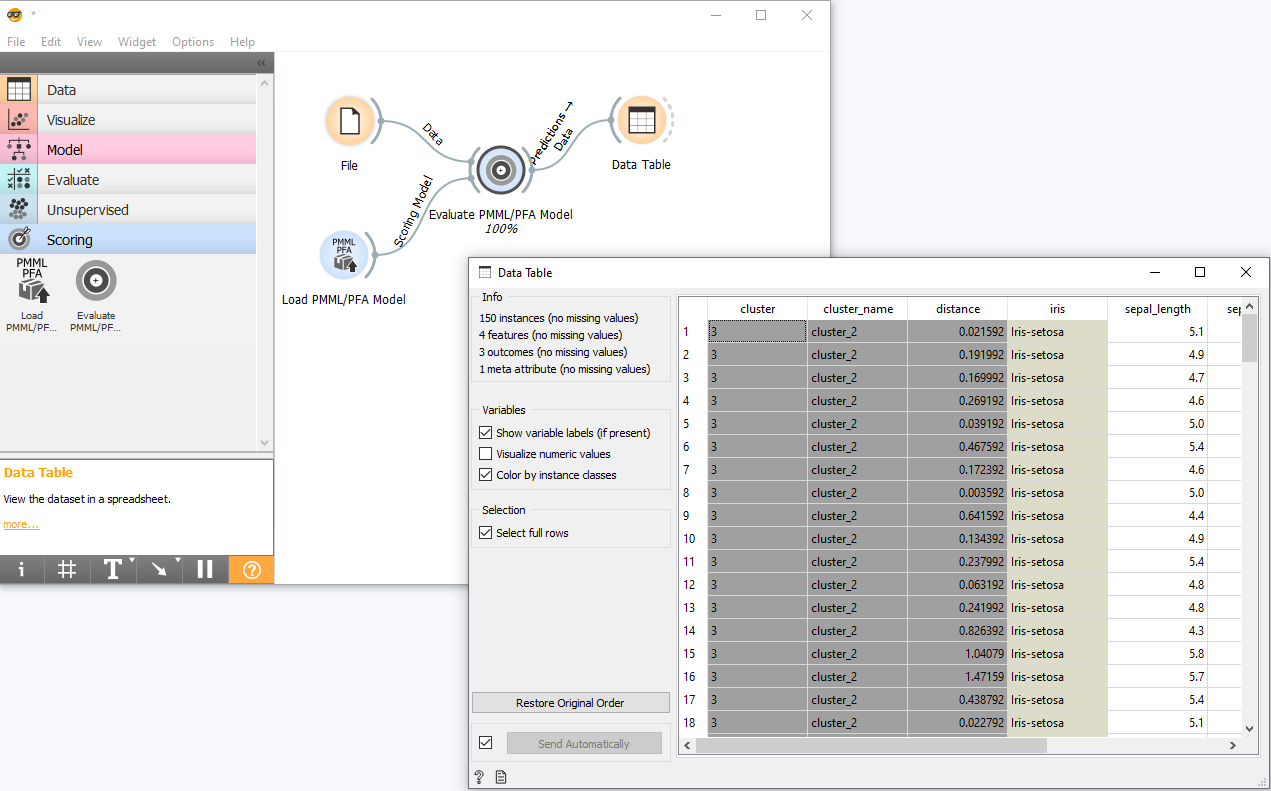
**Step 6**
Connect the output to `Data Table` widget to view the results. 3 new columns (cluster, cluster_name & distance) are added after scoring the data obtained for each input record. The actual class value (Y), if present in the data, is also converted to metadata of the result table.
**Step 7**
Now lets load a PFA Model. Sample PFA File [here](https://github.com/animator/orange3-scoring/blob/master/orangecontrib/scoring/tests/sample_iris.json).
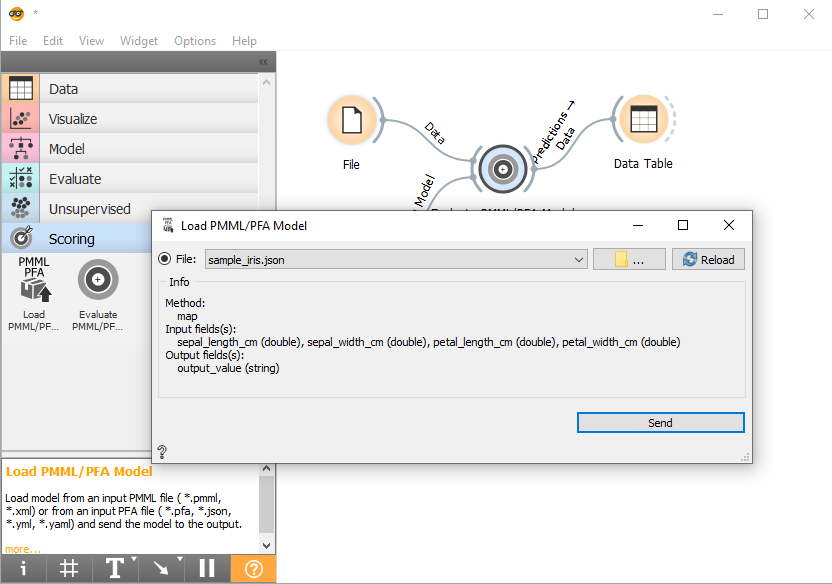
**Step 8**
Score the data using new PFA Model.
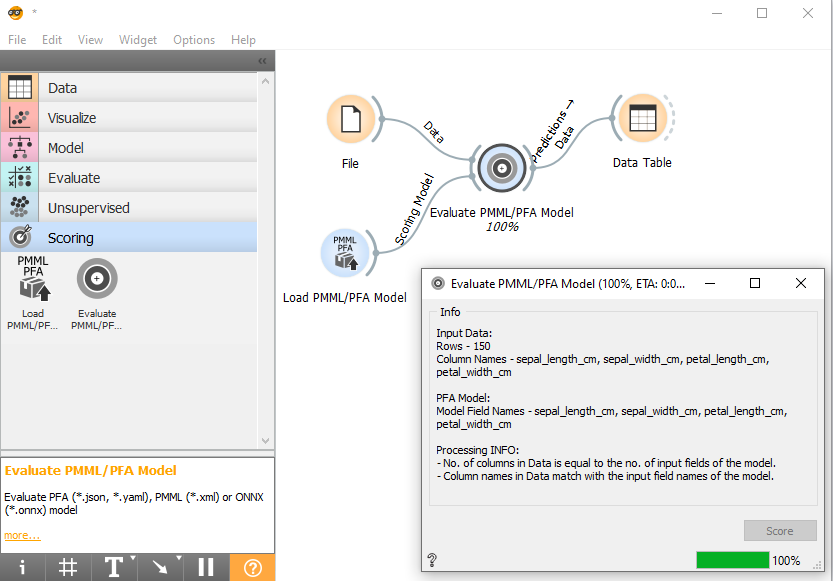
**Step 9**
Now hit `Score` button to score.
**Step 10**
View the results. You can see the predicted class for iris as provided by the PFA Model.
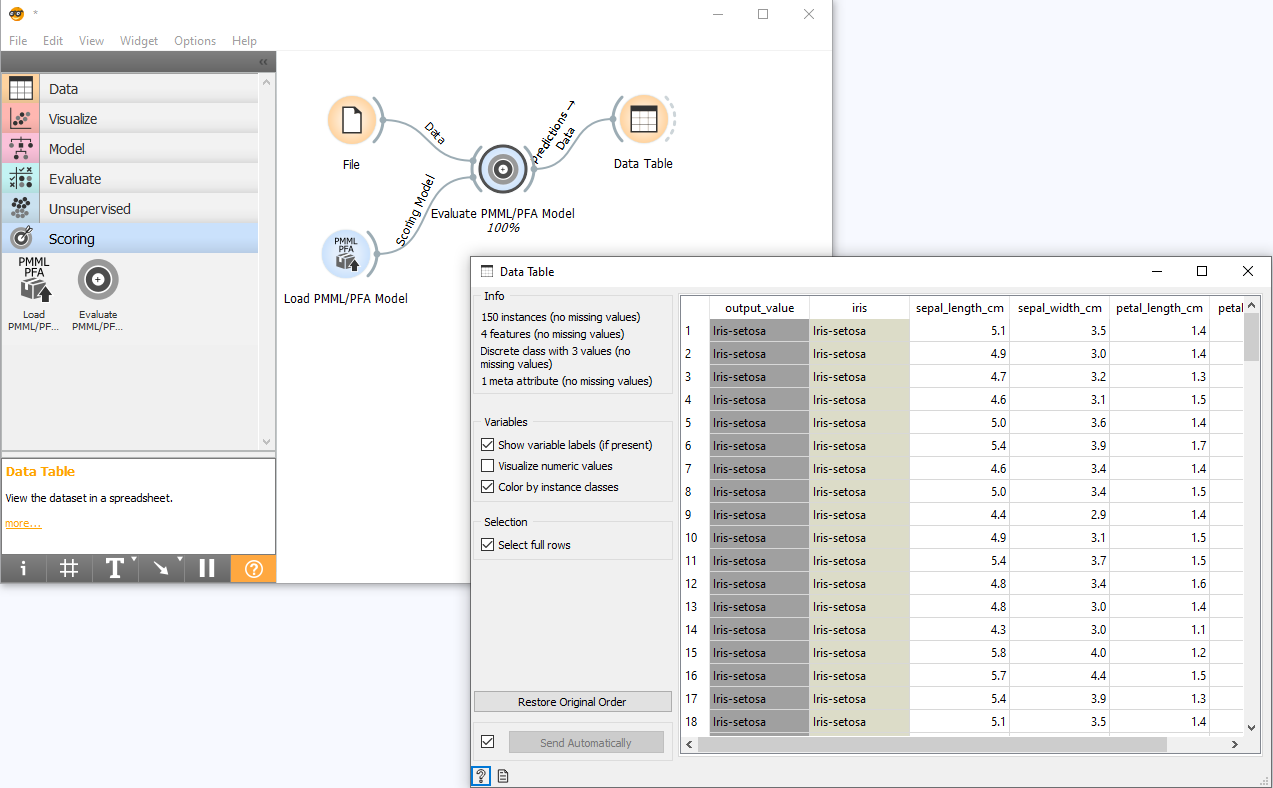
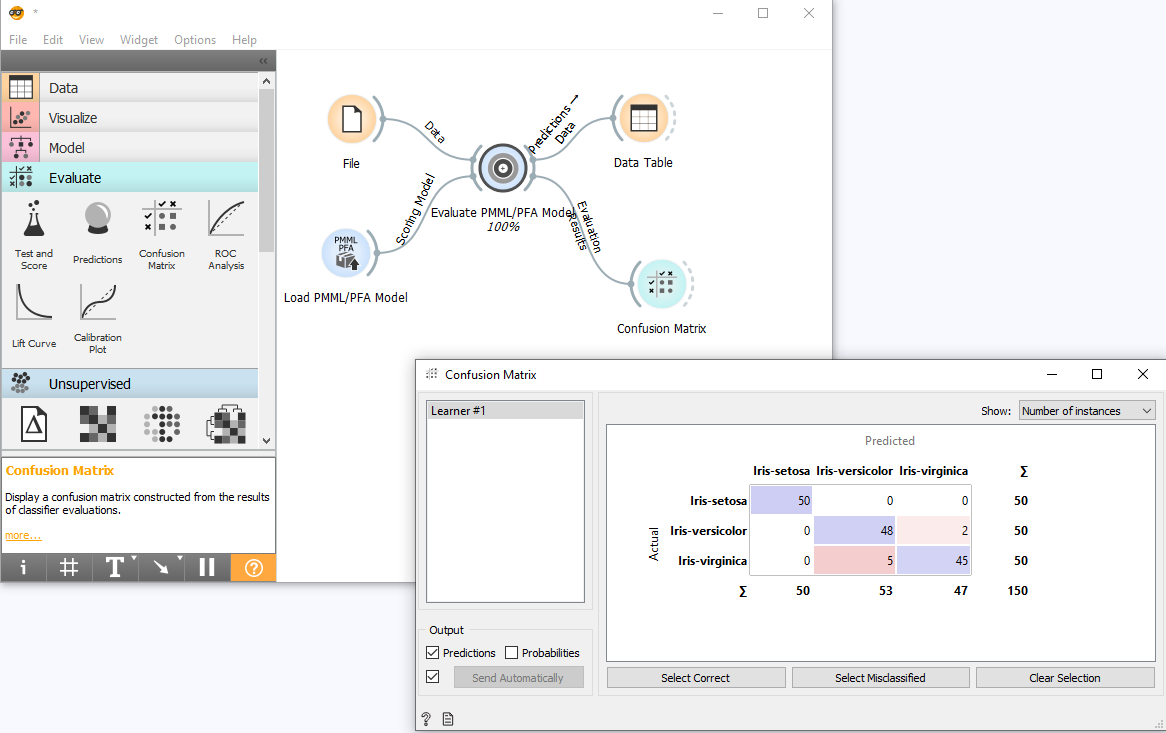
**Step 11**
Another output signal is produced which contains the `Evaluation Results` which can be connected to `Confusion Matrix`, `ROC Analysis` and `Lift Curve` widgets. We can connect it to the `Confusion Matrix` widget to view the difference in predicted and actual results.