https://github.com/animesh-algorithm/car-price-predictor-regression-analysis
Go through the README.md file.
https://github.com/animesh-algorithm/car-price-predictor-regression-analysis
Last synced: 5 months ago
JSON representation
Go through the README.md file.
- Host: GitHub
- URL: https://github.com/animesh-algorithm/car-price-predictor-regression-analysis
- Owner: animesh-algorithm
- Created: 2020-09-29T04:49:22.000Z (almost 5 years ago)
- Default Branch: master
- Last Pushed: 2020-09-29T17:23:48.000Z (almost 5 years ago)
- Last Synced: 2024-12-14T02:38:30.396Z (7 months ago)
- Language: Jupyter Notebook
- Homepage: https://car-price-predictor-1.herokuapp.com/
- Size: 350 KB
- Stars: 0
- Watchers: 2
- Forks: 0
- Open Issues: 0
-
Metadata Files:
- Readme: README.md
Awesome Lists containing this project
README
# Car Price Predictor App - Regression Analysis
## Table of Content
* [Demo](#demo)
* [Abstract](#abs)
* [Motivation](#motivation)
* [About the Data](#data)
* [Feature Engineering And Modeling](#model)
* [The Math Behind the Metrics Used](#metrics)
* [Why I used Polynomial Features?](#poly)
* [Why I converted the numerical data into log normal distribution?](#log)
* [Why I perform One Hot Encoding on the data?](#ohe)
* [Why I did feature scaling?](#fs)
* [Training With Linear Models.](#linear_models)
* [How I found the best model and their best hyperparameters using sklearn Pipelines and GridSearchCV?](#best_model)
* [Credits](#credits)
## Demo
The final Output for the project can be viewed [here](https://car-price-predictor-1.herokuapp.com/)
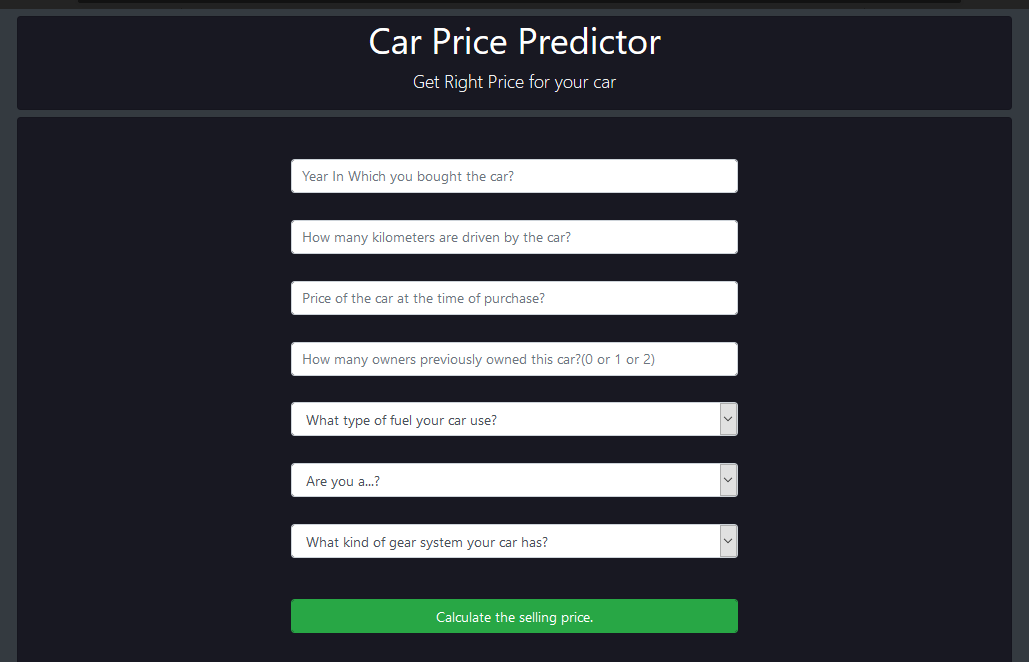
## Abstract
* [Car Price Predictor](https://car-price-predictor-1.herokuapp.com/) is an **end-to-end Machine Learning Regression project**, built using **Flask** and deployed on **Heroku Cloud Platform**, which will help an **individual/dealer** to **predict the price** they can expect for any of their old car they would like to sell. The **dataset** on which the **ML models** are trained is taken from **kaggle**, provided by **cardekho.com**, has 4341 records and 8 dependent features.
* Various **ML models** are **tuned and trained** by making use of **sklearn pipelines and GridSearchCV**. Various **linear models, tree models and ensemble techniques** are employed for training (with all possible hyperparameters properly tuned). Out of them **Lasso(alpha=0.01)** happens to have better **r2-score** and least **Root Mean Squared Error.**
## Motivation
My motivation for this project came from the **#66daysofdata** initiative started by **Ken Jee** from Youtube. If I haven't partipicated in this initiative, I may not be as accountable and consistent as I am in learning Data Science today.
## About the Data
Our dataset has **4341 records** and **9 features**(including dependent feature).
### Brief Description about columns
Columns
Description
Name
Name of the cars
Year
Year of the car when it was bought
Selling_Price
Price at which the car is being sold
Kms_Driven
Number of Kilometres the car is driven
Fuel_Type
Fuel type of car (petrol / diesel / CNG / LPG / electric)
Seller_Type
Tells if a Seller is Individual or a Dealer
Transmission
Gear transmission of the car (Automatic/Manual)
Owners
Number of previous owners of the car.
Name
Name of the cars
## Feature Engineering and Modeling
* ### **The Math behind the metrices used**
* #### R2 Score
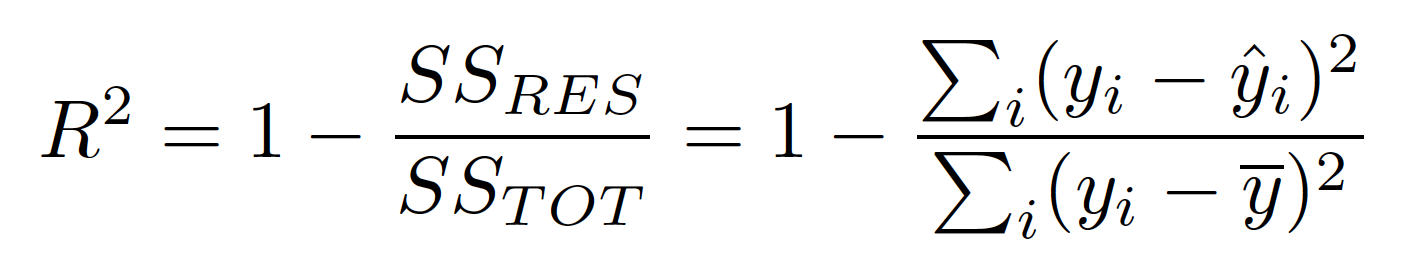
* #### Mean Squared Error
* ### **Why I used Polynomial Features?**
* Earlier for almost all the models, **r2_score** is close to **0.73**
* But after increasing the no. of independent features to 45 using **sklearn.preprocessing.PolynomialFeatures** of **degree 2** the **r2_score** increases to **0.94** i.e
**Our Model is fitting better**, which is evident from the graphs below, which is basically plotted to show the **variance** between the actual and predicted value of Selling Price
Before Applying Polynomial Features | After Applying Polynomial Features

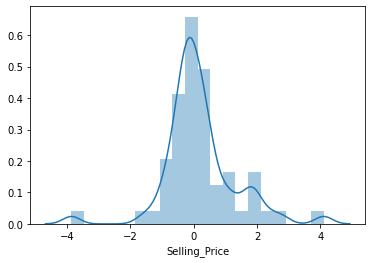
* ### **Why I converted my data into log normal distribution?**
* One of the basic assumption when you are training a **Linear Regression** model or compiling an **Artificial Neural Network** is that your data is **normally distributed**. I plotted the graph, I got some bell curve but I was not sure whether it is perfectly normally distributed. So I performed the **log normal distribution** for all my numerical data.
Before Applying Log Normal Dist. | After Applying Log Normal Dist.


* ### **Why I perform One Hot Encoding on the data?**
* My Data have some categorical features like **Fuel Type, Seller Type and Transmission**, which doesn't make sense to any Machine Learning or Deep Learning Models. Hence they needed to be converted into numerical data and one way to do that is through **One Hot Encoding**, which I did using **pd.get_dummies** function.
* ### **Why I did feature scaling?**
* All of my features have different units, ex. kilometers, no. of years, rupees etc. So I scaled all of my features.
* I tried both **MinMaxScaler()** and **StandardScaler()**, the latter one worked better.
* ### **Training with linear models**
* I trained my dataset with various linear models for ex. **Linear Regression, Lasso Regression, Ridge Regression and Bayesian Ridge Regression**.
* To my surprise all models performed same way with nearly same value of **r2_score, Mean Absolute Error and Mean Squared Error**.
Linear Regression | Lasso Regression


Ridge Regression | Bayesian Ridge Regression


* ### **How I found the best model and their best hyperparameters using sklearn Pipelines and GridSearchCV?**
* I made use of **sklearn pipelines** to its best. I created multiple pipelines with respect to the model and their hyperparameters.
* Then I combined the power of **sklearn pipelines** and **GridSearchCV**, which trained all the models for me, with all the possible hyperparamerter and finally gave the **best model** which in our case happens to be **Lasso(alpha=0.01)**.
* I **dumped** that model using **pickle** library and then **loaded** the model into the **Flask** app.
* The best model gave the following scores -
* R2 Score - 0.9442452908334493
* Mean Absolute Error - 0.7422001552130918
* Mean Squared Error - 1.2843423154102787
* And the following graph for the **variance in Predicted and Actual Value of Selling Price**

* For more deep dive into the modelling stuff you can check out the [Ipython Notebook for Feature Engineering and Choosing Best Model](https://github.com/animesharma3/Car-Price-Predictor---Regression-Analysis/blob/master/Feature%20Engineering%20and%20Choosing%20Best%20Model.ipynb)
## Credits
Special thanks to
* **cardekho.com** for providing the dataset
* **Google Colaboratory** for providing the computational power to build and train the models.
* **Heroku** for making the deployment of this project possible.
* **#66daysofdata** community created by **KenJee** that is keeping me accountable in my Data Science Journey.