https://github.com/antl3x/codeplot
▱ Codeplot is your infinity canvas for data exploration.
https://github.com/antl3x/codeplot
data-science data-visualization dataframe matplotlib pandas python
Last synced: 9 months ago
JSON representation
▱ Codeplot is your infinity canvas for data exploration.
- Host: GitHub
- URL: https://github.com/antl3x/codeplot
- Owner: antl3x
- License: apache-2.0
- Created: 2024-01-24T21:27:24.000Z (over 2 years ago)
- Default Branch: master
- Last Pushed: 2025-03-25T21:53:51.000Z (over 1 year ago)
- Last Synced: 2025-07-08T11:33:39.053Z (about 1 year ago)
- Topics: data-science, data-visualization, dataframe, matplotlib, pandas, python
- Language: TypeScript
- Homepage:
- Size: 13 MB
- Stars: 28
- Watchers: 0
- Forks: 6
- Open Issues: 0
-
Metadata Files:
- Readme: README.md
- License: LICENSE
Awesome Lists containing this project
README

---
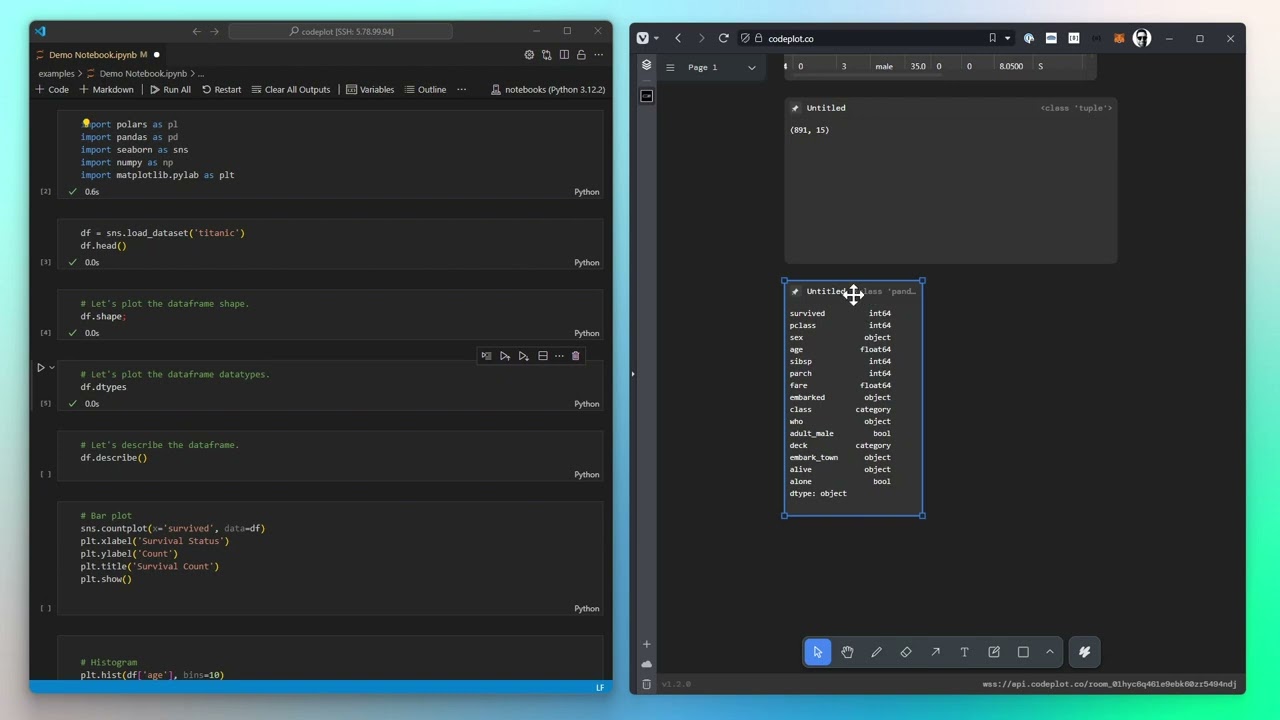
**Codeplot is an infinity canvas for data exploration.**
Think of it as Figma, but for data teams.
Dive in, plot your data, and boost your productivity.
It's data analysis without the scroll.
Your go-to tool for an amazing Exploratory Data Analysis workflow.
Created by [@antl3x](https://github.com/antl3x), [read more](https://antl3x.co/posts/2024-01-25-today-i-decided-to-create-a-tool-that-i-always-wanted/) about its inception.
# Video Demo
[](https://youtu.be/x7QLEu5t17g)
**Why Choose codeplot?**
- **Dynamic Visualization**: Break free from static images and rigid layouts. codeplot brings your data to life on an interactive canvas.
- **Easy Integration**: Directly plot from your Python code or REPL into your canvas at [codeplot.co](https://codeplot.co).
- **Varied Visualizations**: From basic charts to advanced widgets, codeplot supports a wide range of data representations.
- **Flexible Layouts**: Arrange your visualizations to suit your workflow, with draggable and movable plots.
- **Open to Everyone**: Designed for data scientists and enthusiasts alike, codeplot aims to enhance your data exploration experience.
# Getting Started (IPython Extension)
To use codeplot in a IPython environment like Jupyter, Google Colab, etc, you can install the IPython Extension using pip:
```bash
pip install codeplot-ipython
```
After install you can load the extension and connect to a new room:
```python
%load_ext codeplot-ipython
%cP_connect ws://your-ws-url/your-room-id
```
Now the output of your cells will be automatically plotted in the codeplot canvas! So you don't need to use the `cP.plot` function.
Take a look at [the Notebook Example](/examples/Demo%20Notebook.ipynb)
Thats all!
# Getting Started (Python SDK)
If you want to use codeplot in a Python script, and have a more "fine-grained" control over the plots, you can use the Python SDK.
To get started with codeplot, you can install the package using pip:
```bash
pip install codeplot
```
Once installed, you can start using codeplot by importing the package and connectig to a new room:
```python
import asyncio
import codeplot
async def main():
cP = await codeplot.connect("ws://your-ws-url/your-room-id")
# Now you can start plotting
await cP.plot(df.describe())
await cP.plot(df.head(10))
await cP.plot(df)
asyncio.run(main())
```
Take a look at [the Notebook (SDK Example)](/examples/Demo%20Notebook%20(SDK).ipynb)
---
## Demo - codeplot.co
You can use the public codeplot client & server to start plotting right away:
1. Join the codeplot room at [codeplot.co](https://codeplot.co)
2. Use the room id to connect to the room using the code above
# Run Codeplot on Docker
Instead of using the public codeplot server, you can self-host and run codeplot on your local machine using Docker. To do so, you can use the following command:
```bash
curl -s https://raw.githubusercontent.com/codeplot-co/codeplot/master/minirepos/@codeplot-docker/docker-compose.yaml | docker-compose -f - up
```
Or if you are using docker-compose v2, you can use the following command instead
```bash
curl -s https://raw.githubusercontent.com/codeplot-co/codeplot/master/minirepos/@codeplot-docker/docker-compose.yaml | docker compose -f - up
```
This will start a codeplot server and a client on your local machine, and you can access it at:
- Client: [http://localhost:9107](http://localhost:9107)
- Server: [ws://localhost:9108](ws://localhost:9108)
**Join the codeplot Community**
Become part of a forward-thinking community dedicated to advancing data visualization. Connect, engage, and grow with peers on **[Discord](https://codeplot.co/discord)**. With codeplot, data visualization is a shared journey. Let's explore new insights together!
# License
Codeplot is open source software licensed under the Apache License 2.0. This means you can use, modify, and distribute the software for any purpose, including commercial use. See the [LICENSE](LICENSE) file for details.