Ecosyste.ms: Awesome
An open API service indexing awesome lists of open source software.
https://github.com/antonfisher/d3-time-logarithmic-scale-chart
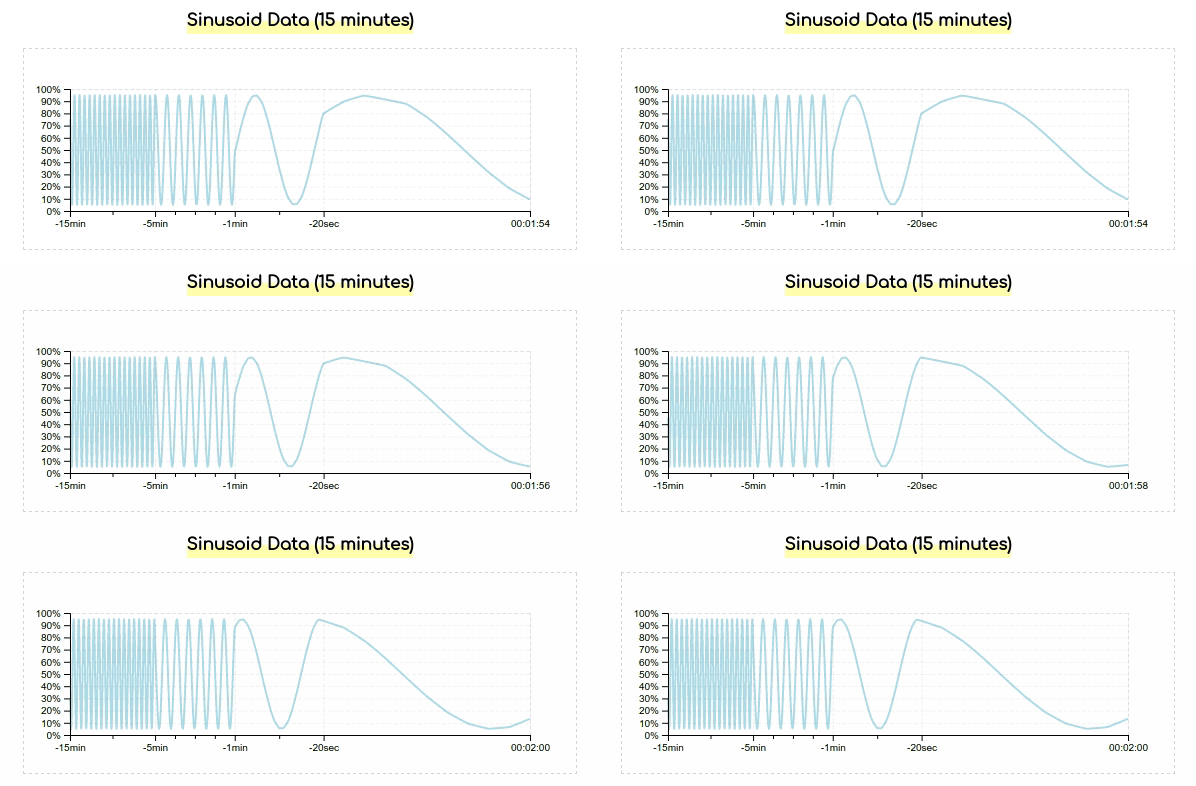
D3 Time Logarithmic Scale Chart using d3.v4.js
https://github.com/antonfisher/d3-time-logarithmic-scale-chart
d3js javascrit
Last synced: 10 days ago
JSON representation
D3 Time Logarithmic Scale Chart using d3.v4.js
- Host: GitHub
- URL: https://github.com/antonfisher/d3-time-logarithmic-scale-chart
- Owner: antonfisher
- License: mit
- Created: 2017-05-27T06:35:01.000Z (over 7 years ago)
- Default Branch: master
- Last Pushed: 2017-06-01T07:09:06.000Z (over 7 years ago)
- Last Synced: 2024-11-05T19:43:41.628Z (about 2 months ago)
- Topics: d3js, javascrit
- Language: HTML
- Homepage: https://antonfisher.com/d3-time-logarithmic-scale-chart/
- Size: 486 KB
- Stars: 0
- Watchers: 3
- Forks: 0
- Open Issues: 0
-
Metadata Files:
- Readme: README.md
- License: LICENSE
Awesome Lists containing this project
README
# D3 Time Logarithmic Scale Chart
Using d3.v4.js
[](https://antonfisher.com/d3-time-logarithmic-scale-chart/)
[Live demo](https://antonfisher.com/d3-time-logarithmic-scale-chart/)
## Usage
Add the library script on the page:
```html
```
Add chart container:
```html
```
Render the chart:
```html
const chartEl = document.getElementById('chart');
new TimeLogarithmicScaleChart(chartEl, data);
```
## API
```js
// parent DOM Element
const chartEl = document.getElementById('chart');
// an array of objects {time: , value: }
const data = [
{time: Date().now() - 60 * 1000, value: 0},
{time: Date().now(), value: 10}
];
// config object
const config = {
animation: true,
curve: d3.curveCardinal.tension(0.75),
debug: false,
margin: 40,
minInterval: '1h',
stroke: 'lightblue',
strokeWidth: 2,
yTickFormat: '.0%'
};
// render chart
const chart = new TimeLogarithmicScaleChart(chartEl, data, config);
// update chart
chart.update(newData);
```