https://github.com/apollo-roboto/discord.py-ext-prometheus
Add Prometheus to your Discord bot with this handy extension
https://github.com/apollo-roboto/discord.py-ext-prometheus
discord discord-bot grafana grafana-dashboard prometheus python
Last synced: 7 months ago
JSON representation
Add Prometheus to your Discord bot with this handy extension
- Host: GitHub
- URL: https://github.com/apollo-roboto/discord.py-ext-prometheus
- Owner: Apollo-Roboto
- License: mit
- Created: 2022-12-09T02:57:34.000Z (almost 3 years ago)
- Default Branch: main
- Last Pushed: 2024-03-10T20:18:15.000Z (over 1 year ago)
- Last Synced: 2024-05-21T07:28:00.976Z (over 1 year ago)
- Topics: discord, discord-bot, grafana, grafana-dashboard, prometheus, python
- Language: Python
- Homepage: https://pypi.org/project/discord-ext-prometheus/
- Size: 38.1 KB
- Stars: 14
- Watchers: 2
- Forks: 5
- Open Issues: 2
-
Metadata Files:
- Readme: README.md
- Contributing: CONTRIBUTING.md
- Funding: .github/FUNDING.yml
- License: LICENSE
Awesome Lists containing this project
README
# discord-ext-prometheus


This is a extension library for [discord.py](https://github.com/Rapptz/discord.py) that makes it easy to add prometheus metrics to your Python Discord bot.
# Installation
```bash
pip install discord-ext-prometheus
```
# Exposed Metrics
| Name | Documentation | Labels |
|--------------------------------|-----------------------------------------------|-----------------------------------|
| `discord_connected` | Determines if the bot is connected to Discord | `shard` |
| `discord_latency_seconds` | Latency to Discord | `shard` |
| `discord_event_on_interaction` | Amount of interactions called by users | `shard`, `interaction`, `command` |
| `discord_event_on_command` | Amount of commands called by users | `shard`, `command` |
| `discord_stat_total_guilds` | Amount of guild this bot is a member of | None |
| `discord_stat_total_channels` | Amount of channels this bot is has access to | None |
| `discord_stat_total_users` | Amount of users this bot can see | None |
| `discord_stat_total_commands` | Amount of commands | None |
| `logging` | Log entries | `logger`, `level` |
Notes:
- `on_interaction` are application interactions such as slash commands or modals
- `on_command` are traditional message commands (usualy using the command prefix)
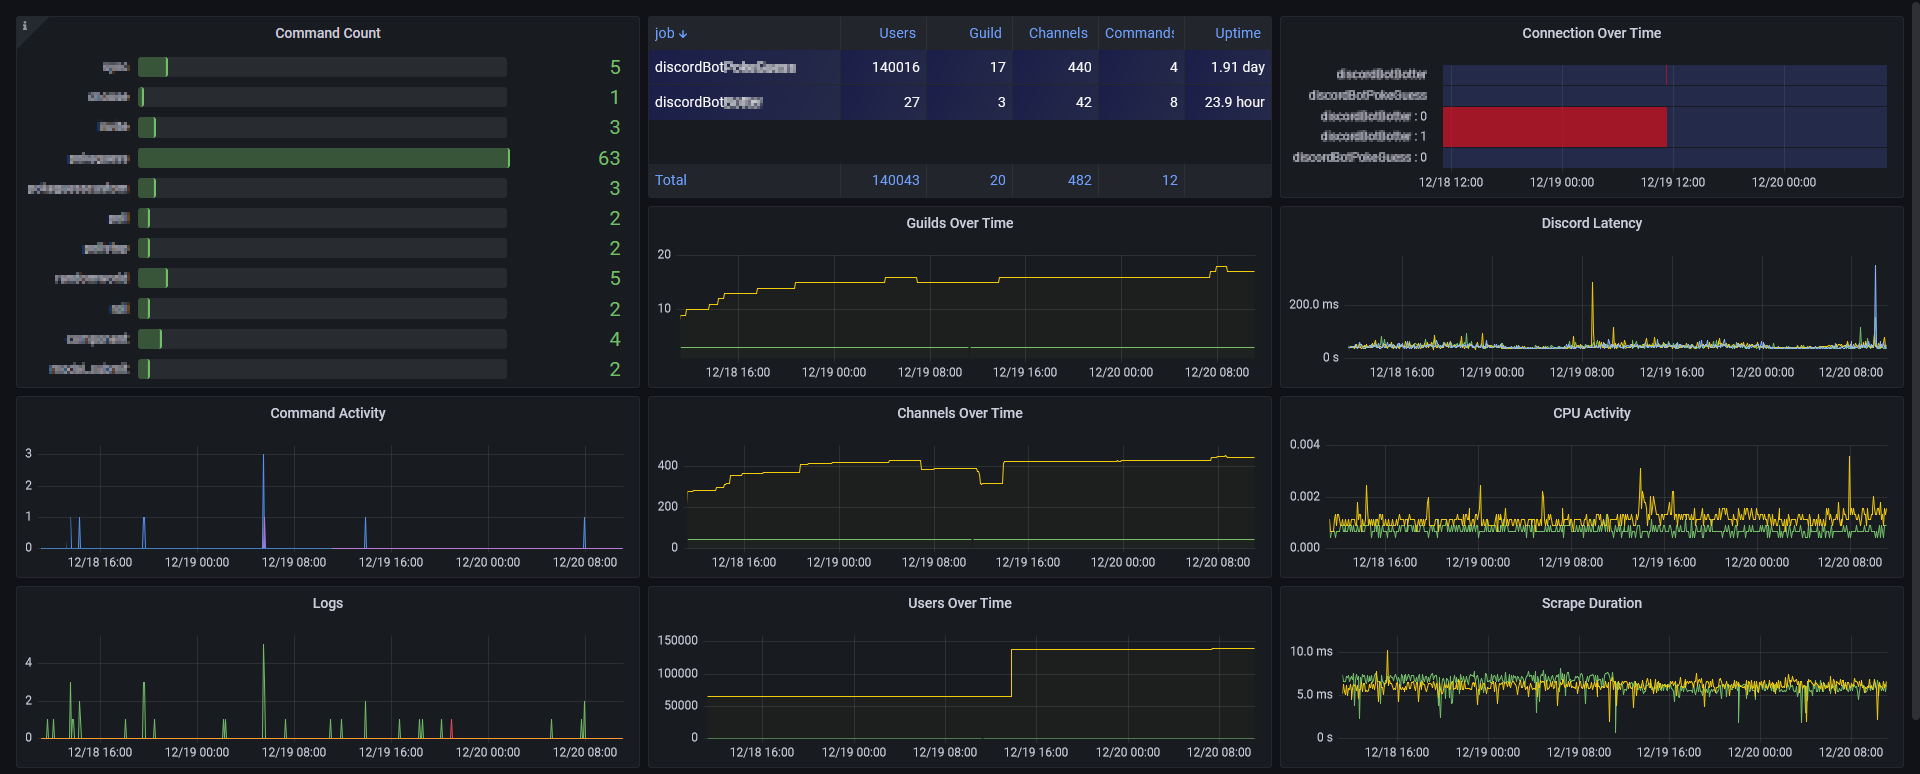
# Grafana Dashboard

Available to import from [Grafana dashboards](https://grafana.com/grafana/dashboards/17670-discord-bot/).
# How to use
This extension won't do much by itself, you must have an instance of [Prometheus](https://prometheus.io/) configured to collect those metrics and an instance of [Grafana](https://grafana.com/grafana/) to visualize it.
Once the cog is added to your bot, the Prometheus metric endpoint can be accessed
at `localhost:8000/metrics`.
## Sample code with the Prometheus Cog
```python
import asyncio
from discord import Intents
from discord.ext import commands
from discord.ext.prometheus import PrometheusCog
async def main():
bot = commands.Bot(
command_prefix="!",
intents=Intents.all(),
)
await bot.add_cog(PrometheusCog(bot))
await bot.start("YOUR TOKEN")
asyncio.run(main())
```
## Sample code with logging metrics
```python
import asyncio
import logging
from discord import Intents
from discord.ext import commands
from discord.ext.prometheus import PrometheusCog, PrometheusLoggingHandler
logging.getLogger().addHandler(PrometheusLoggingHandler())
async def main():
bot = commands.Bot(
command_prefix="!",
intents=Intents.all(),
)
await bot.add_cog(PrometheusCog(bot))
@bot.listen()
async def on_ready():
logging.info(f"Logged in as {bot.user.name}#{bot.user.discriminator}")
logging.info("Starting the bot")
await bot.start("YOUR TOKEN")
asyncio.run(main())
```
## Changing the Prometheus port
The default port is `8000` but can be changed while creating the cog.
```python
await bot.add_cog(PrometheusCog(bot, port=7000))
```
## Configuring Prometheus
Here is a quick example scrape config that you would write in `prometheus.yml`. *(make sure to replace name and host accordinly)*
```yaml
scrape_configs:
- job_name: "discordBot{{ name }}"
static_configs:
- targets: ["{{ host }}:8000"]
```