https://github.com/apparebit/shantay
Trying to make sense of the EU's DSA Transparency DB
https://github.com/apparebit/shantay
bigdata content-moderation dsa eu python transparency
Last synced: about 1 year ago
JSON representation
Trying to make sense of the EU's DSA Transparency DB
- Host: GitHub
- URL: https://github.com/apparebit/shantay
- Owner: apparebit
- License: apache-2.0
- Created: 2025-02-22T22:53:18.000Z (over 1 year ago)
- Default Branch: boss
- Last Pushed: 2025-04-12T08:08:34.000Z (about 1 year ago)
- Last Synced: 2025-04-12T08:32:43.030Z (about 1 year ago)
- Topics: bigdata, content-moderation, dsa, eu, python, transparency
- Language: HTML
- Homepage:
- Size: 3.82 MB
- Stars: 0
- Watchers: 1
- Forks: 0
- Open Issues: 0
-
Metadata Files:
- Readme: README.md
- License: LICENSE
Awesome Lists containing this project
README
# Shantay
*Shantay* is a [permissively
licensed](https://github.com/apparebit/shantay/blob/boss/LICENSE), open-source,
Python-based command line tool for analyzing the European Commission's [DSA
transparency database](https://transparency.dsa.ec.europa.eu/). That database
collects the anonymized statements of reasons for online platforms' content
moderation decision. Even though the database is huge, 1.5 TB and growing,
*shantay* runs on consumer hardware. All you need is a USB drive, such as the 2
TB Samsung T7, that is large enough to store the full database and, for some
tasks, patience, as they may take all day (or night).
I've written [a blog post about my initial
impressions](https://apparebit.com/blog/2025/sashay-shantay) of the DSA
transparency database. Let's just say that, Brussels, we've got, uhm, problems
(plural)!
## 1. Getting Started
*Shantay*'s Python package is [distributed through
PyPI](https://pypi.org/project/shantay/). Hence, you can use a Python tool
runner such as [pipx](https://github.com/pypa/pipx) or
[uvx](https://docs.astral.sh/uv/guides/tools/) for executing *shantay* without
even installing it:
```bash
$ pipx shantay -h
```
or
```bash
$ uvx shantay -h
```
In either case, *shantay* will output its help message, which describes command
line options and tasks in detail. But to get you acquainted, here are a few
examples:
The EU started operating the database on the 25th of September, 2023. To
download the daily releases for that year and determine summary statistics for
them, you execute:
```
$ uvx shantay --archive --last 2023-12-31 summarize
```
Except, you want to replace `` with the path to a directory suitable
for storing the complete database.
The previous command will run for a while, downloading and analyzing release
after release after release. Depending on your hardware, using more than one
process for downloading and analyzing the data may be faster. The following
invocation, for example, uses three worker processes for downloading and
analyzing data:
```
$ uvx shantay --archive --last 2023-12-31 --multiproc 3 summarize
```
Don't forget to replace `` with the actual path.
When running with parallel worker processes, *shantay*'s original process serves
as coordinator. Notably, it updates the status display on the console and writes
log entries to a file, by default `shantay.log` in the current working
directory. Note that the queue-based forwarding mechanism preserves the ordering
of messages originating from the same process but no more. Messages from
different processes may be arbitrarily interleaved.
Once *shantay* is done downloading and summarizing the daily releases for 2023,
you'll find a `statistics.parquet` file in the archive's root directory. To
visualize that same data, execute:
```
$ uvx shantay --archive visualize
```
Once finished, you'll find an `overview.html` document with all charts in the
default staging directory `dsa-db-staging`.
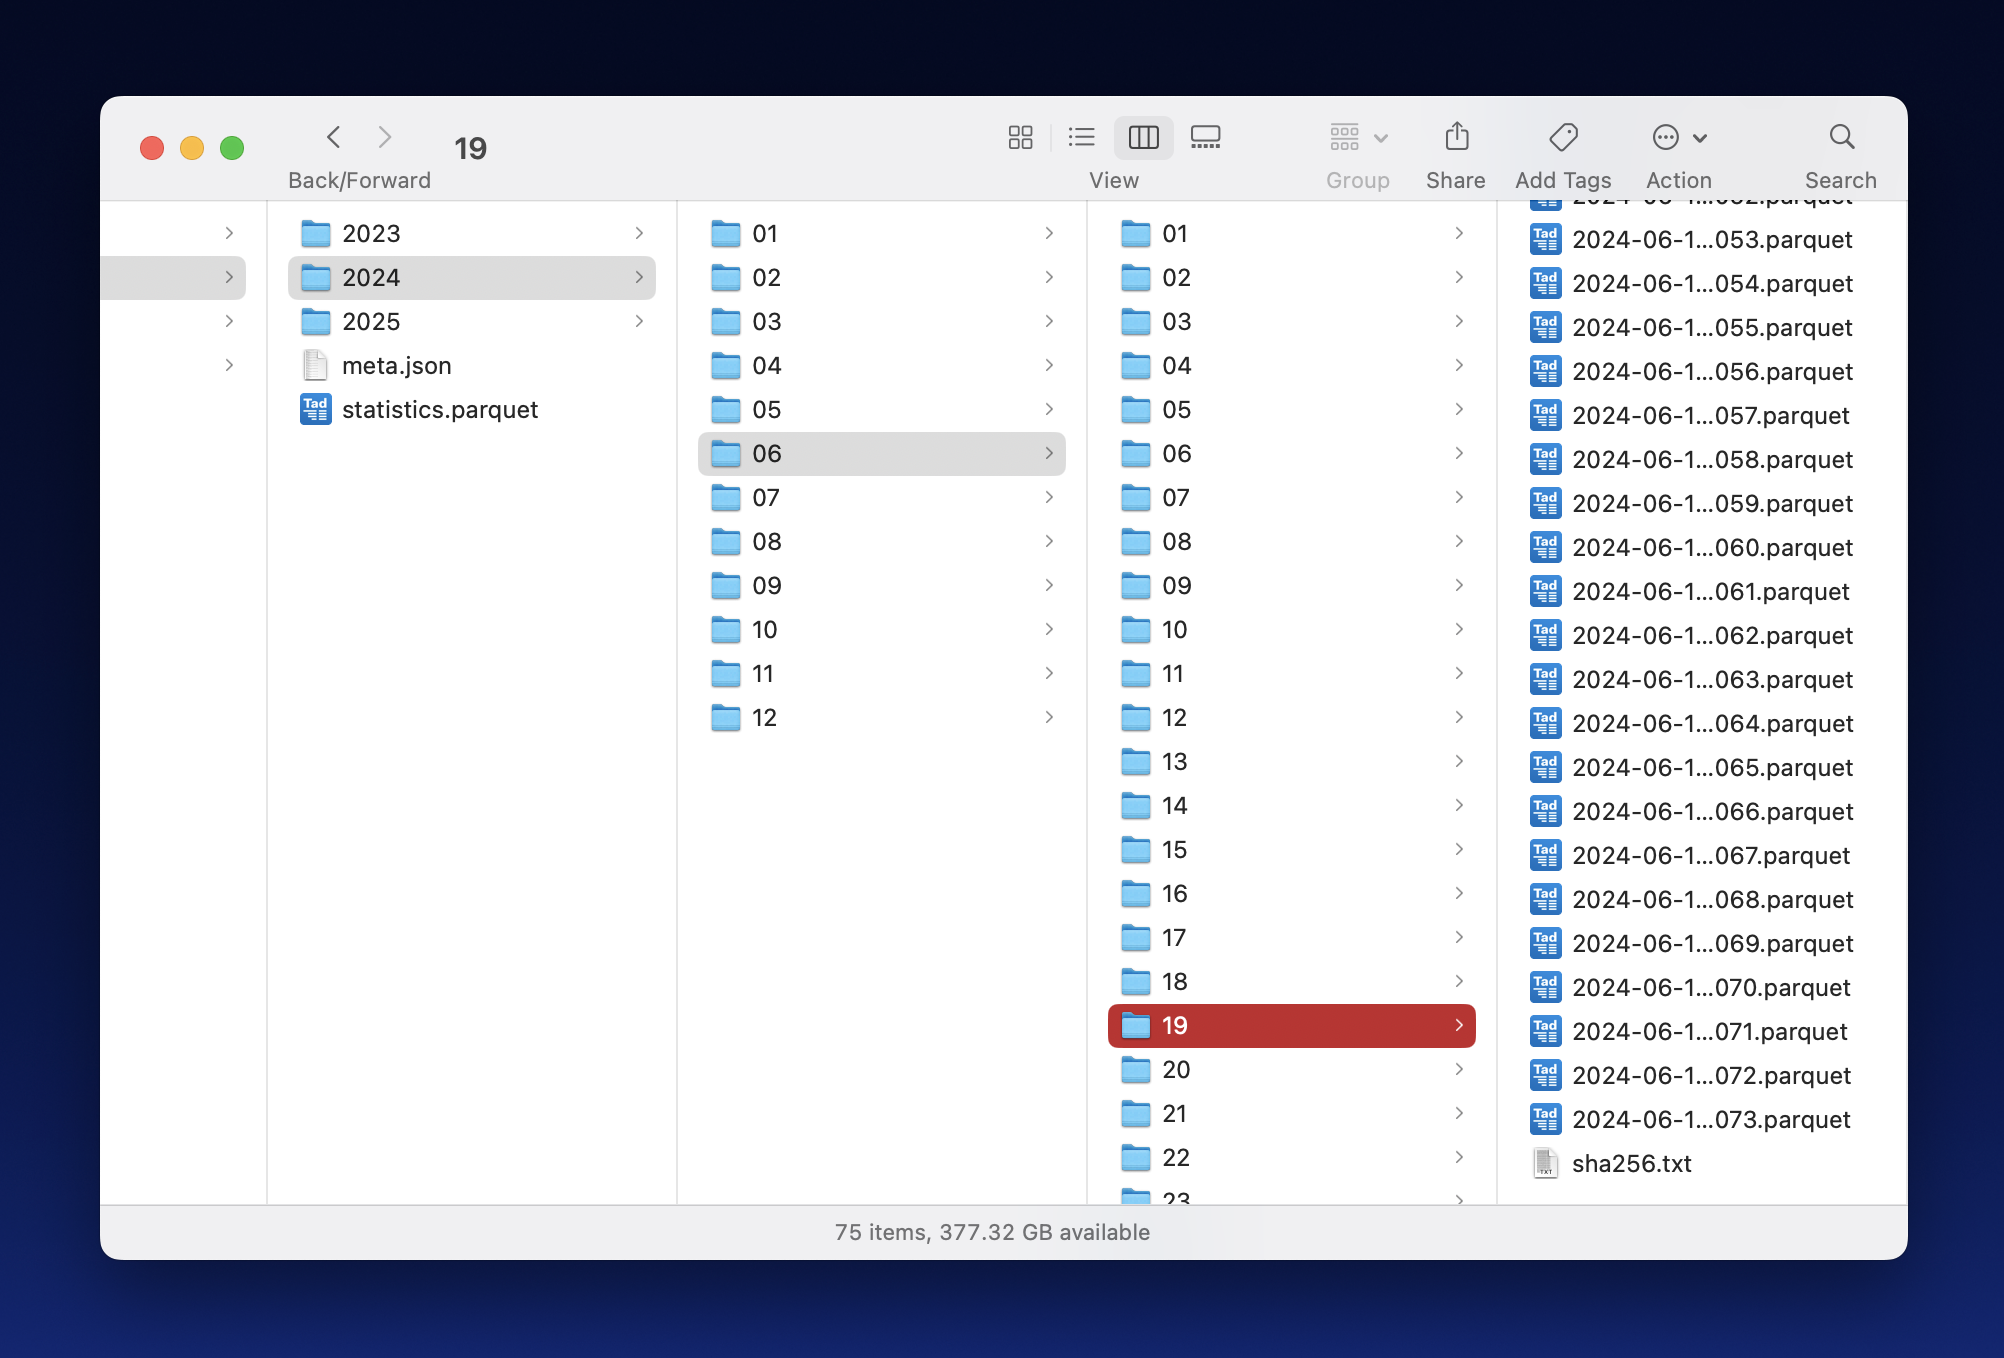
## 2. Organization of Storage
The screenshot below shows an example directory hierarchy under the *working*
root. It illustrates the directory levels discussed in 2.2 as well as the files
with digests and summary statistics discussed in 2.3.
### 2.1 Three Root Directories: Staging, Archive, Working
*Shantay* distinguishes between three primary directories, *staging* as
temporary storage, *archive* for the original distributions, and *working* for a
practical subset:
1. *Staging* stores data currently being processed, e.g., by uncompressing,
converting, and filtering it. You wouldn't be wrong if you called this
directory *temp* or *tmp* instead. This directory must be on a fast, local
file system; it should not be on an external disk, particularly not if the
disk is connected with USB.
2. *Archive* stores the original, daily ZIP files and their SHA1 digests. It is
append-only storage and holds the ground truth. This directory must be on a
large file system, e.g., 2 TB as minimum. It may be on an external drive
(such as the T7 mentioned before).
3. *Working* stores parquet files with a (much) smaller subset of the database.
Like *archive*, *working* is treated as append-only storage. Unlike
*archive*, which is unique, different runs of *shantay* may use different
*working* directories representing different subsets of the database.
### 2.2 Three Levels of Nested Directories: Year, Month, Day
Under the three root directories, *shantay* arranges files into a hierarchy of
directories, e.g., resulting in paths like
`2025/03/14/2025-03-14-00000.parquet`. The top level is named for years,
followed by two-digit months one level down, followed by two-digit days another
level down. Finally, batch files have a zero-based five-digit index.
In addition to the data files, *shantay* maintains a per-day digest file named
`sha256.txt`, which contains the SHA-256 digests for every batch file in the
directory: Each line contains one hexadecimal ASCII digest, a space,and the
batch file's name.
### 2.3 Summary Statistics: `meta.json` and `statistics.parquet`
In addition to yearly directories, *shantay* also stores th following two files
inside root directories.
- `meta.json` contains an object with the `filter` used for selecting the
working data and some statistics about `releases`. `batch_count` must be the
number of batch files and `sha256` must be the (recursive) digest of the
digests in the `sha256.txt` file.
- `statistics.parquet` contains daily or monthly summary statistics about
(part of) the dataset. It basically is a non-tidy, long data frame that uses
up to four columns for identifying variables and as many columns for
identifying values. While an encoding with fewer columns is eminently
feasible, the current scheme is optimized for selecting and aggregating
quantities.
The individual columns are:
- `start_date` and `end_date` denote the date coverage of a row.
- `tag` is a symbolic tag for filtered source data.
- `column` is the original transparency database column, with a few
virtual column names added.
- `entity` describes the metric contained in that row.
- `variant` and `variant_too` capture database column values, which usually
are enumeration constants.
- `count`, `min`, `mean`, and `max` contain the eponymous descriptive
statistics, which all aggregate differently.
## 3. Running Tasks
As illustrated above, each invocation of *shantay* performs a single task.
Including the *summarize* and *visualize* tasks used in the above examples,
*shantay* supports the following tasks:
* __recover__ to check whether the files in a directory hierarchy conform to
*shantay*'s naming conventions and cover a continuous time period. Also
rebuilds some of the metadata in `meta.json`.
* __prepare__ to download daily database releases that haven't been downloaded
und to extract a subset of the statements of reasons readily amenable to
iterative analysis and visualization.
* __analyze__ to compute statistics about the downloaded and extracted working
data.
* __summarize__ to download daily database releases that haven't been
downloaded and to collect summary statistics for the entire database.
* __visualize__ to generate production-quality timeline charts based on the
statistical data collected for the analyze and summarize tasks.
[overview.html](https://apparebit.github.io/shantay/overview.html)
By definition, summarize produces more comprehensive statistics than prepare &
analyze. But summarize is also much slower and requires more memory. In fact, it
is so slow that iterating over questions and metrics is impractical. For just
that reason, I implemented prepare & analyze well before summarize, after I had
introduced a standard set of metrics. In other words, it took the experience of
implementing prepare & analyze to convince me that summarize was a realistic
possibility.
Unlike most commercial solutions for Big Data, *shantay* purposefully limits
itself to running on consumer hardware. But that doesn't mean that it should be
gratuitously slow. On the contrary, *shantay* relies on the fast
[Pola.rs](https://pola.rs) data frame and also supports parallel execution for
prepare, analyze, and summarize. In basic testing, that yielded a speedup of
1.7x for two worker processes, i.e., not perfect but still noticeable.
### 3.1 Generic vs Bespoke Analysis and Visualization
In the current implementation, the summarize task yields information about the
entire transparency database, but `prepare` and `analyze` produce information
specific to the protection of minors, the focus of my own research. Still, most
of the code doing the preparing and analyzing is entirely generic and not tied
to a specific category of statements of reasons. Furthermore, even visualization
is driven by declarative schemas defined in the
[`shantay.schema`](https://github.com/apparebit/shantay/blob/boss/shantay/schema.py)
module, which ensures that they are easily reconfigurable and reusable.
Since *shantay* does not yet expose configuration options for directing its
analysis/summarization, you may need to update some code for your own research
purposes. In addition to `shantay.schema`, you'll find the following two modules
useful:
- [`shantay.framing`](https://github.com/apparebit/shantay/blob/boss/shantay/framing.py)
contains the code for collecting summary statistics from the working data.
Much of it is generic, driven by a single schema. In particular, `Collector`
extracts the summary statistics, incrementally building a (non-tidy) long
data frame; the `predicate`, `get_count`, `aggregates`, `is_categorical`,
and `is_duration` functions help access the summary statistics; and
`formatted_summary` produces a table with a summary of the summary
statistics.
- [`shantay.viz`](https://github.com/apparebit/shantay/blob/boss/shantay/viz.py)
contains the code for visualizing the summary statistics through its
`Visualizer`. It renders text to the console or text and graphs to Jupyter
notebooks, while also generating a HTML document. As far as graphs are
concerned, the `monthly_statistic` method generates the vast majority of
timelines based on `MetricDeclaration` instances in `shantay.schema`. Each
instance comprises the information necessary for turning the transparency
database's internal values ("`KEYWORD_ONLINE_BULLYING_INTIMIDATION`") into
human-readable labels ("Bullying") and to assign colors from [Observable's
bright and friendly color
palette](https://observablehq.com/blog/crafting-data-colors)
----
(C) 2025 by Robert Grimm. The Python source code in this repository has been
released as open source under the [Apache
2.0](https://github.com/apparebit/shantay/blob/boss/LICENSE) license.