https://github.com/arapov/bird-plot
A Python tool that converts Tick.com.au personality profiling data into quadrant-based radar charts for individual, group, and pairwise comparisons of the four bird personality types (Eagle, Dove, Owl, and Peacock).
https://github.com/arapov/bird-plot
personality-profiling tick
Last synced: over 1 year ago
JSON representation
A Python tool that converts Tick.com.au personality profiling data into quadrant-based radar charts for individual, group, and pairwise comparisons of the four bird personality types (Eagle, Dove, Owl, and Peacock).
- Host: GitHub
- URL: https://github.com/arapov/bird-plot
- Owner: arapov
- License: apache-2.0
- Created: 2025-01-13T09:24:29.000Z (over 1 year ago)
- Default Branch: master
- Last Pushed: 2025-03-03T12:37:47.000Z (over 1 year ago)
- Last Synced: 2025-03-09T18:45:50.479Z (over 1 year ago)
- Topics: personality-profiling, tick
- Language: Python
- Homepage: https://github.com/arapov/bird-plot
- Size: 108 MB
- Stars: 0
- Watchers: 1
- Forks: 0
- Open Issues: 0
-
Metadata Files:
- Readme: README.md
- License: LICENSE
Awesome Lists containing this project
README
# Bird-Plot
**Bird-Plot** is a Python-based visualization tool for generating quadrant-style plots of [tick.com.au](https://tick.com.au)’s four-bird personality styles (Eagle, Dove, Owl, and Peacock). It takes as input a data file (e.g., CSV) of individual or group personality scores and produces informative charts that help users quickly see:
- **Individual** personality radar plots
- **Team** or **group** distributions in a quadrant layout
- **Pairwise** comparisons (overlap of two individuals’ personalities)
These plots are especially useful for workshops, coaching sessions, and team-building exercises, as they visualize how individuals align or differ on the four “bird” dimensions.
[The Tick personality profiling system](https://tick.com.au) has been appreciated by many in the fields of sales training, leadership coaching, and personal development for its simplicity and ease of communication. Bird-Plot leverages this established framework to provide clear, accessible visualizations that help users understand and compare personality traits quickly. While the tool provides valuable insights and serves as a catalyst for discussion and reflection, users are encouraged to complement these insights with additional information and professional judgment.
---
## Table of Contents
1. [Features](#features)
2. [Installation](#installation)
3. [Usage](#usage)
4. [Input Data Format](#input-data-format)
5. [Example Outputs](#example-outputs)
---
## Features
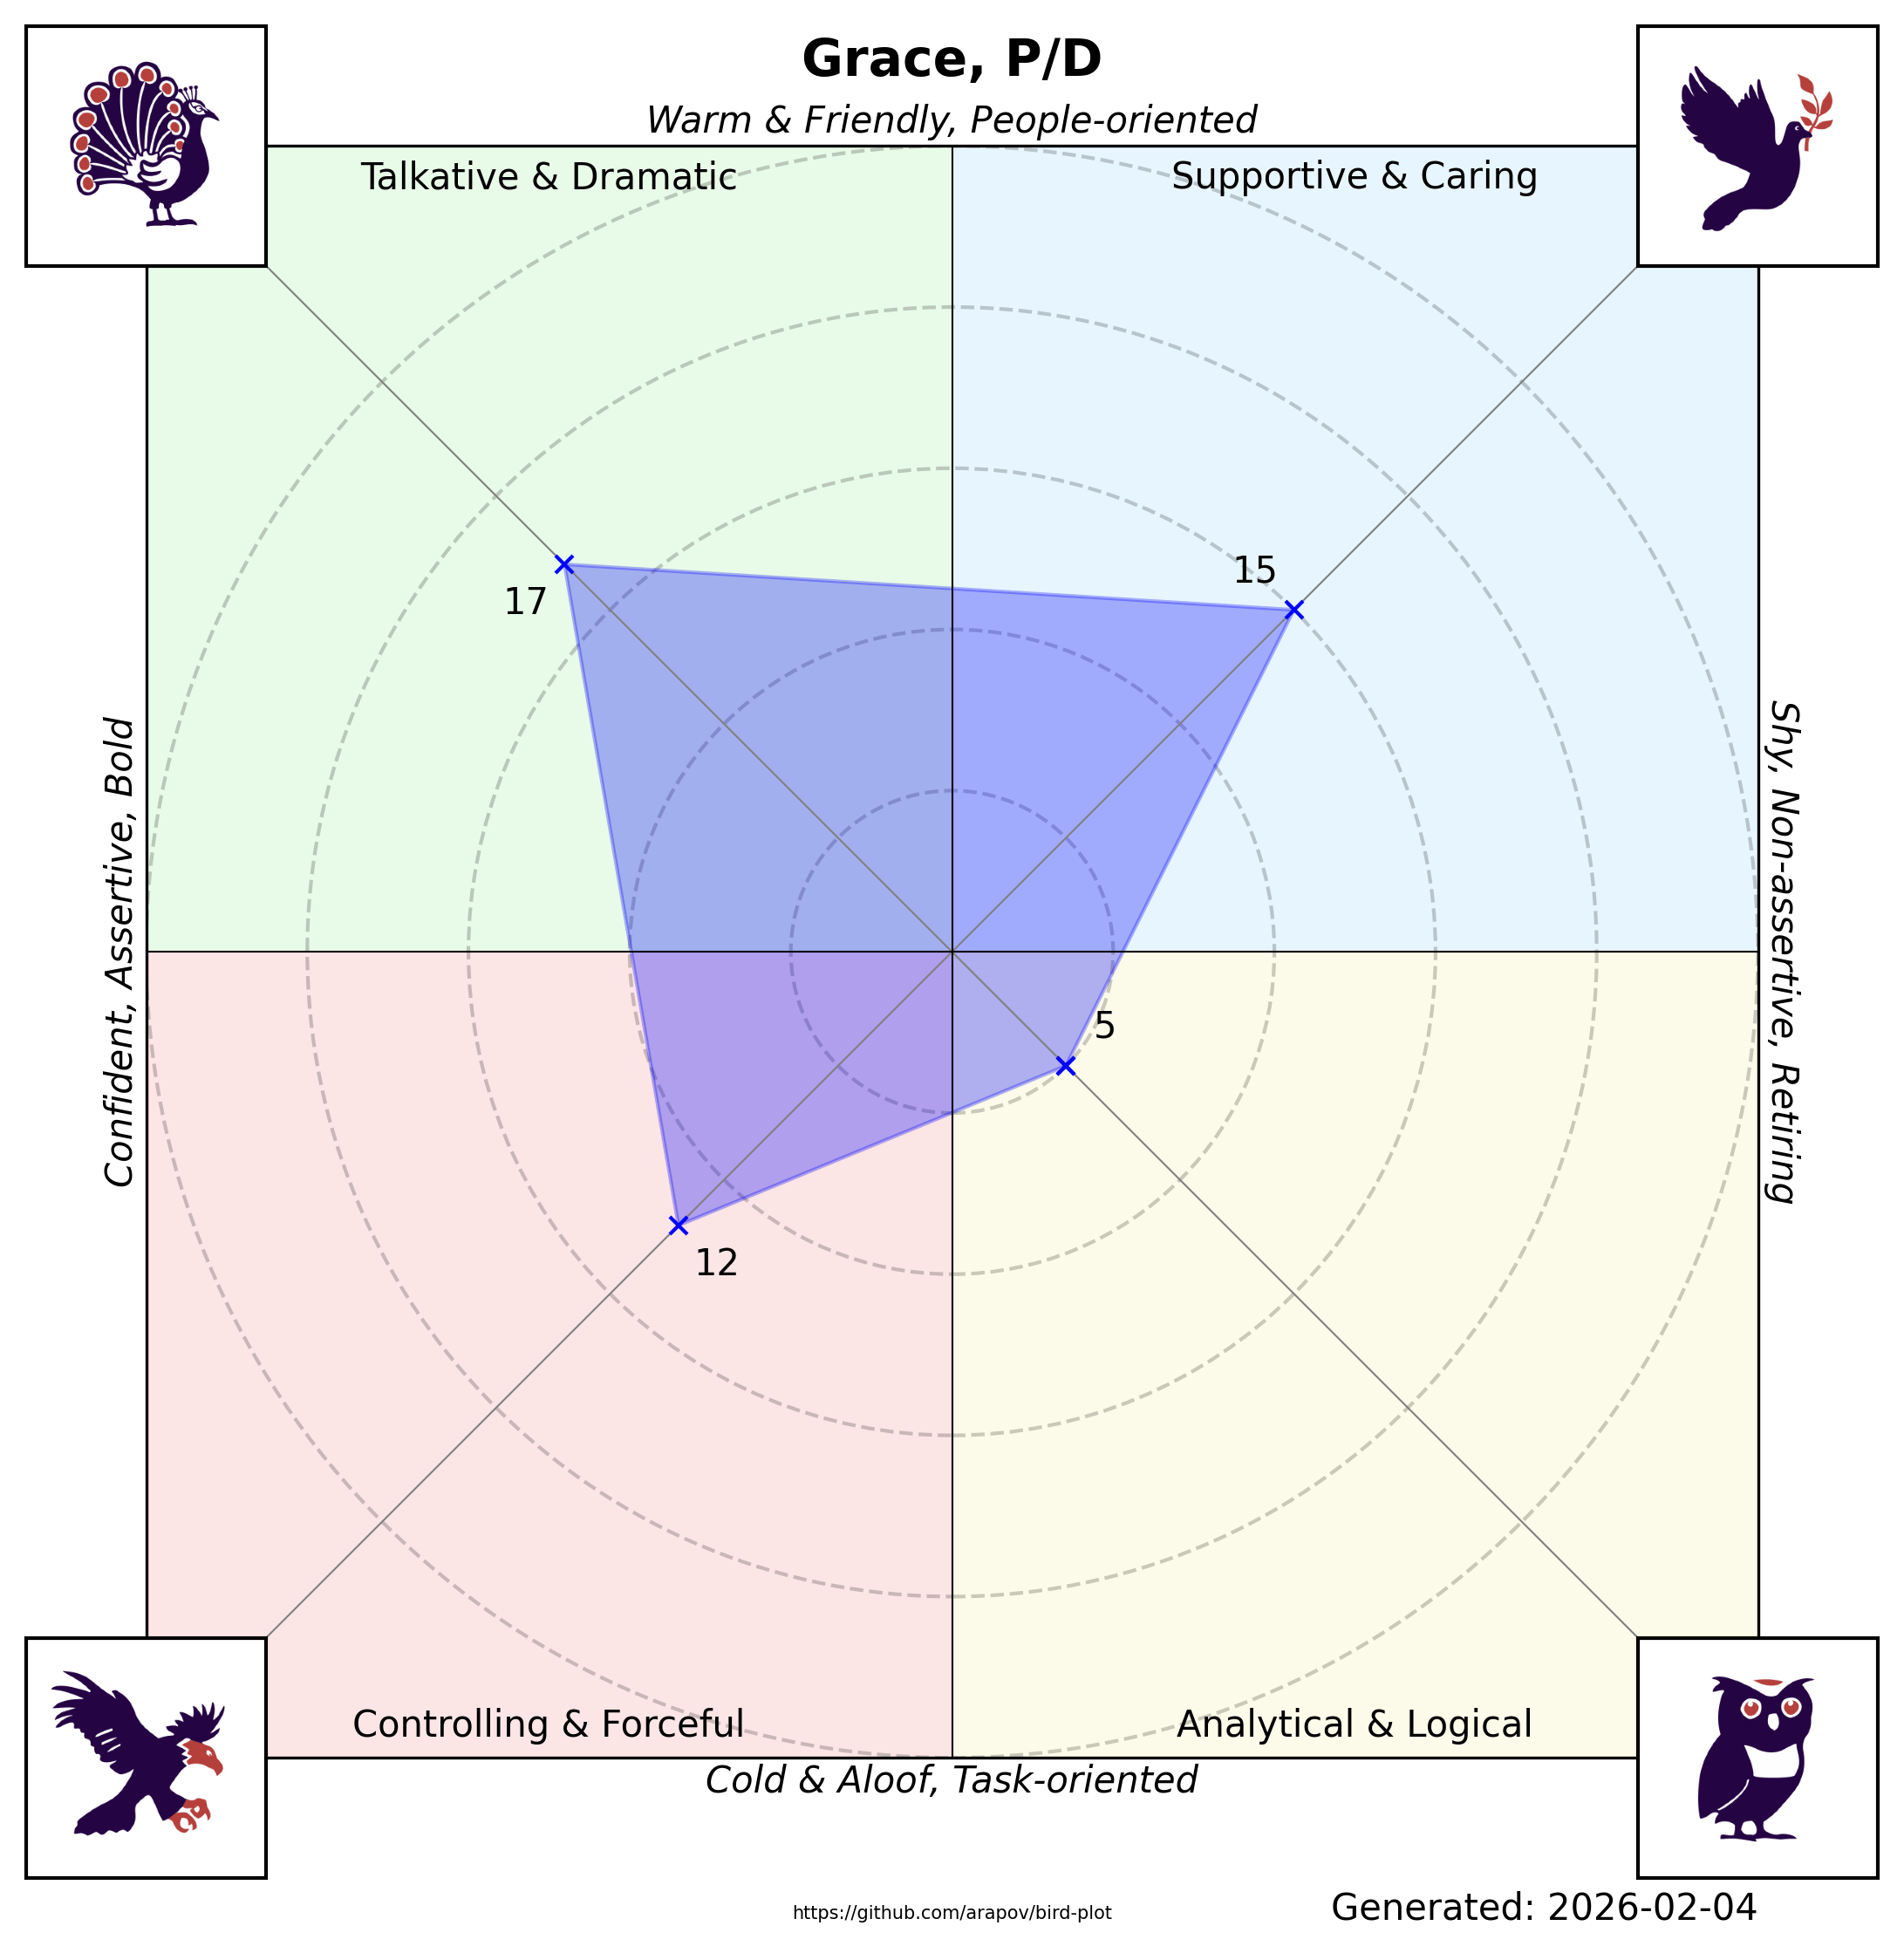
- **Radar Plot** for individuals:
- Shows how a single person’s personality scores map onto the four quadrants.
- A polygon connecting each dimension’s score.
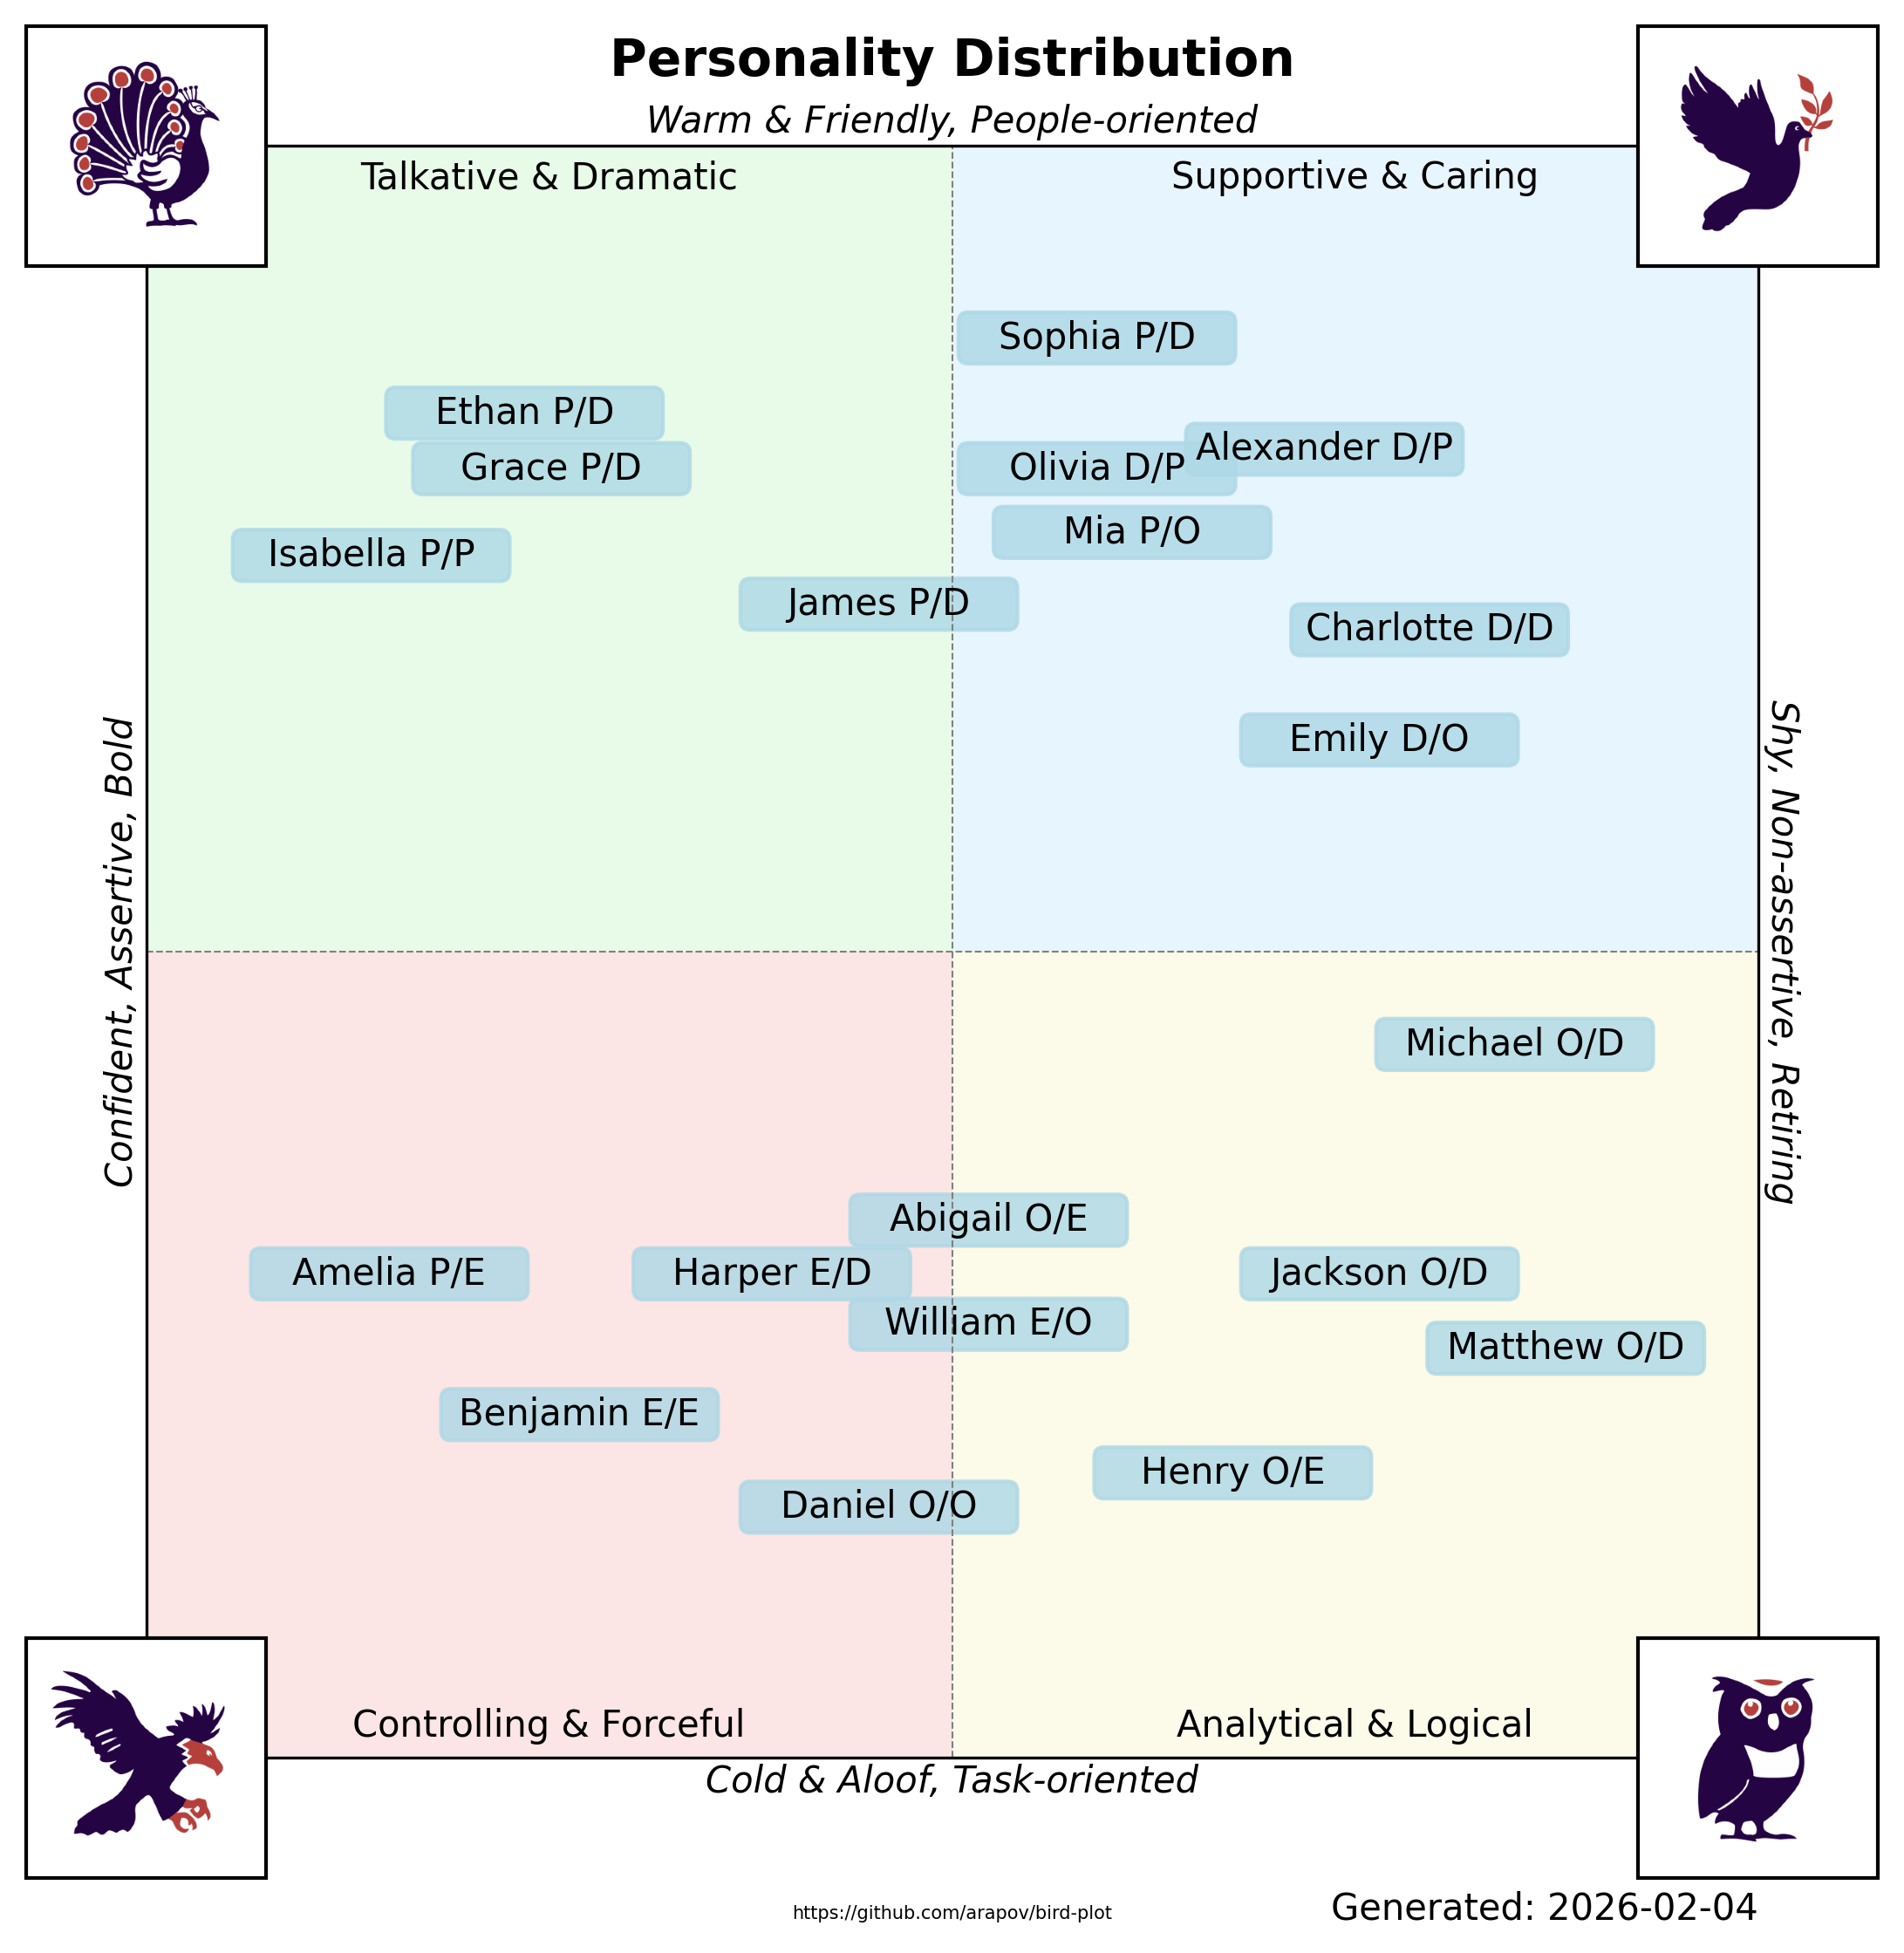
- **Team/Group Distribution**:
- Plots multiple people on a quadrant-based chart, illustrating the distribution of personalities in a single view.
- Useful for quickly identifying group strengths, diversity, and potential gaps.
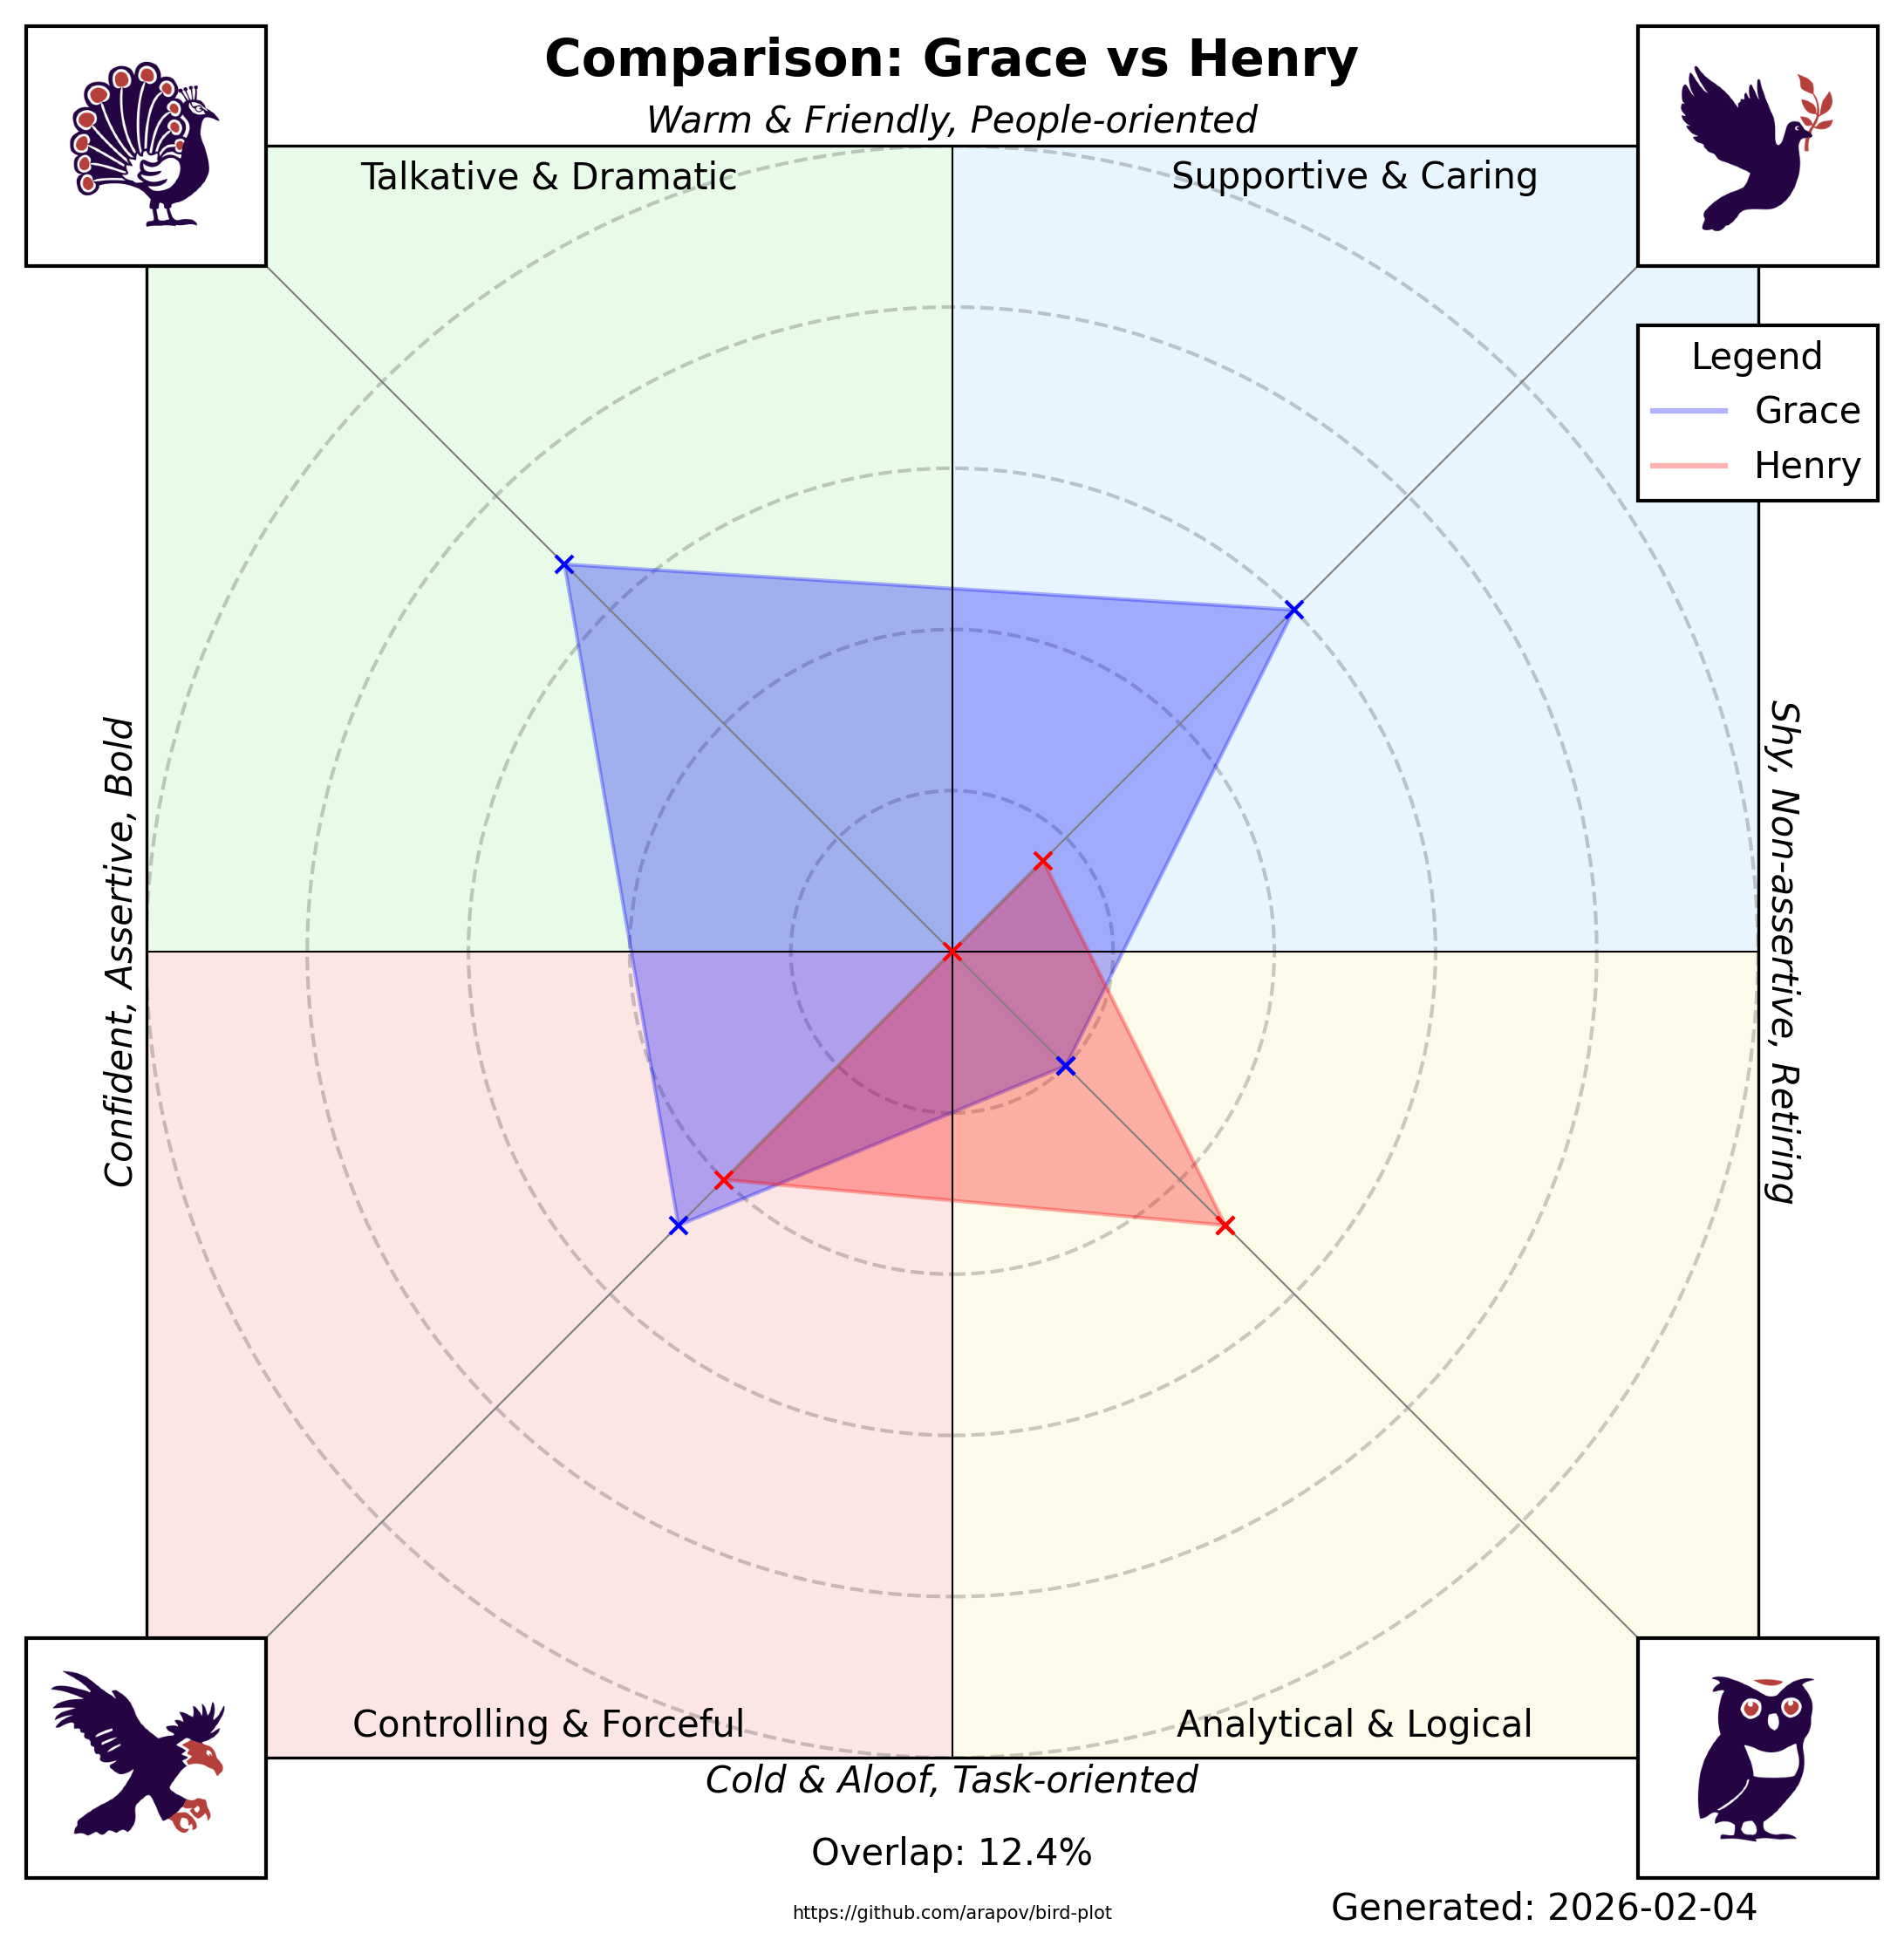
- **Pairwise Comparison**:
- Overlays two individuals’ radar polygons on the same chart to highlight similarities and differences.
- Displays a percentage overlap for a quick gauge of alignment.
---
## Installation
1. **Clone or Download the Repository**
```bash
git clone https://github.com/arapov/bird-plot.git
cd bird-plot
```
2. **Install Dependencies with Poetry**
This project uses [Poetry](https://python-poetry.org/) for dependency management.
```bash
poetry install
```
3. **(Optional) Activate the Virtual Environment**
```bash
poetry shell
```
Or you can use poetry run ... without activating the shell.
4. **Verify Installation**
```bash
poetry run bird-plot --help
```
This should display a help message with usage instructions.
## Usage
1. **Prepare Your Data**
Ensure you have a CSV or similar data file that includes each person’s scores. (See [Input Data Format](#input-data-format) below.)
2. **Run Bird-Plot**
```bash
poetry run bird-plot --data data.csv --graph radar scatter
```
- --data Path to the CSV data file (default: data.csv)
- --graph Type of graph to generate (radar or scatter)
3. **Check Generated Plots**
The script will create .png files in the charts folder.
_Note: Run `poetry run bird-plot --help` for detailed usage._
## Input Data Format
| Name | Dove | Eagle | Owl | Peacock | Note |
| ----- | ---- | ----- | --- | ------- | ---- |
| Grace | 15 | 12 | 5 | 17 | P/D |
| Henry | 4 | 10 | 12 | 0 | O/E |
| ... | ... | ... | ... | ... | ... |
- **Name**: The individual’s name or identifier.
- **Dove, Eagle, Owl, Peacock**: Numeric scores representing each “bird” trait.
- **Note**: Individual's primary and secondary dominant "bird" traits, separated by a forward slash.
## Example Outputs
1. **Individual Radar Plot**
- Plots one person’s scores around four axes (Eagle, Dove, Owl, Peacock).
- The polygon edges connect each axis’s numeric value, visually representing personality strengths.
2. **Group/Team Distribution - Scatter Plot**
- Displays multiple names on a quadrant chart.
- Each quadrant corresponds to a “bird” style, with positions indicating how strongly each person aligns to one or more dimensions.
3. **Comparison/Overlap Plot**
- Overlays two radar plots for a side-by-side comparison.
- Shows an “Overlap” percentage as a measure of similarity.
_(Note: The above images are illustrative examples.)_
## License
This project is licensed under the [Apache 2.0 License](LICENSE). You are free to use, modify, and distribute this software in accordance with the license terms.