https://github.com/arasgungore/three-phase-synchronous-generator
A MATLAB project which analyzes a three-phase stand-alone synchronous generator.
https://github.com/arasgungore/three-phase-synchronous-generator
course-project energy-conversion generator induction-machine induction-motor latex-documentation latex-report matlab matlab-plotting motor phasor phasor-addition phasor-diagram phasors power-factor-correction quiver quiver-plots rotor-dynamics synchronous-generator three-phase-induction-machines
Last synced: about 1 year ago
JSON representation
A MATLAB project which analyzes a three-phase stand-alone synchronous generator.
- Host: GitHub
- URL: https://github.com/arasgungore/three-phase-synchronous-generator
- Owner: arasgungore
- License: mit
- Created: 2022-06-17T12:44:48.000Z (about 4 years ago)
- Default Branch: main
- Last Pushed: 2024-01-15T13:13:45.000Z (over 2 years ago)
- Last Synced: 2025-04-12T18:33:32.123Z (over 1 year ago)
- Topics: course-project, energy-conversion, generator, induction-machine, induction-motor, latex-documentation, latex-report, matlab, matlab-plotting, motor, phasor, phasor-addition, phasor-diagram, phasors, power-factor-correction, quiver, quiver-plots, rotor-dynamics, synchronous-generator, three-phase-induction-machines
- Language: MATLAB
- Homepage:
- Size: 811 KB
- Stars: 7
- Watchers: 2
- Forks: 1
- Open Issues: 0
-
Metadata Files:
- Readme: README.md
- License: LICENSE
Awesome Lists containing this project
README
# three-phase-synchronous-generator
A MATLAB project which analyzes a 13.8 kV, 50 MVA, 0.9–power–factor–lagging, 60 Hz, four-pole Y–connected three-phase stand-alone synchronous generator.
This project was assigned for the Energy Conversion (EE 304) course in the Spring 2022 semester.
## Run on Terminal
```sh
matlab -nodisplay -nosplash -nodesktop -r "run('main.m');exit;"
```
## Description
A 13.8 kV, 50 MVA, 0.9–power–factor–lagging, 60 Hz, four-pole Y–connected synchronous generator has a synchronous reactance of 2.5 Ω and an armature resistance of 0.2 Ω. At 60 Hz, its friction and windage losses are 1 MW, and its core losses are 1.5 MW. The field circuit has a DC voltage of 120 V, and the maximum field current,
, is 10 A. The current of the field circuit, , is adjustable over the range from 0 to 10 A for which the OCC of this generator is given as:
=20%5C,(1.05-%5Cexp(-0.3%5C,I_F))%5C;kV)
In all of the plots, the phasors need to be in vector shapes, not as simple lines.
1. Create a MATLAB function for plotting the phasor diagram of the generator for different values of the stator current , the field current , the terminal voltage , and the power angle. Explain briefly in your report theoretical calculations and include the code in the appendix of the report.
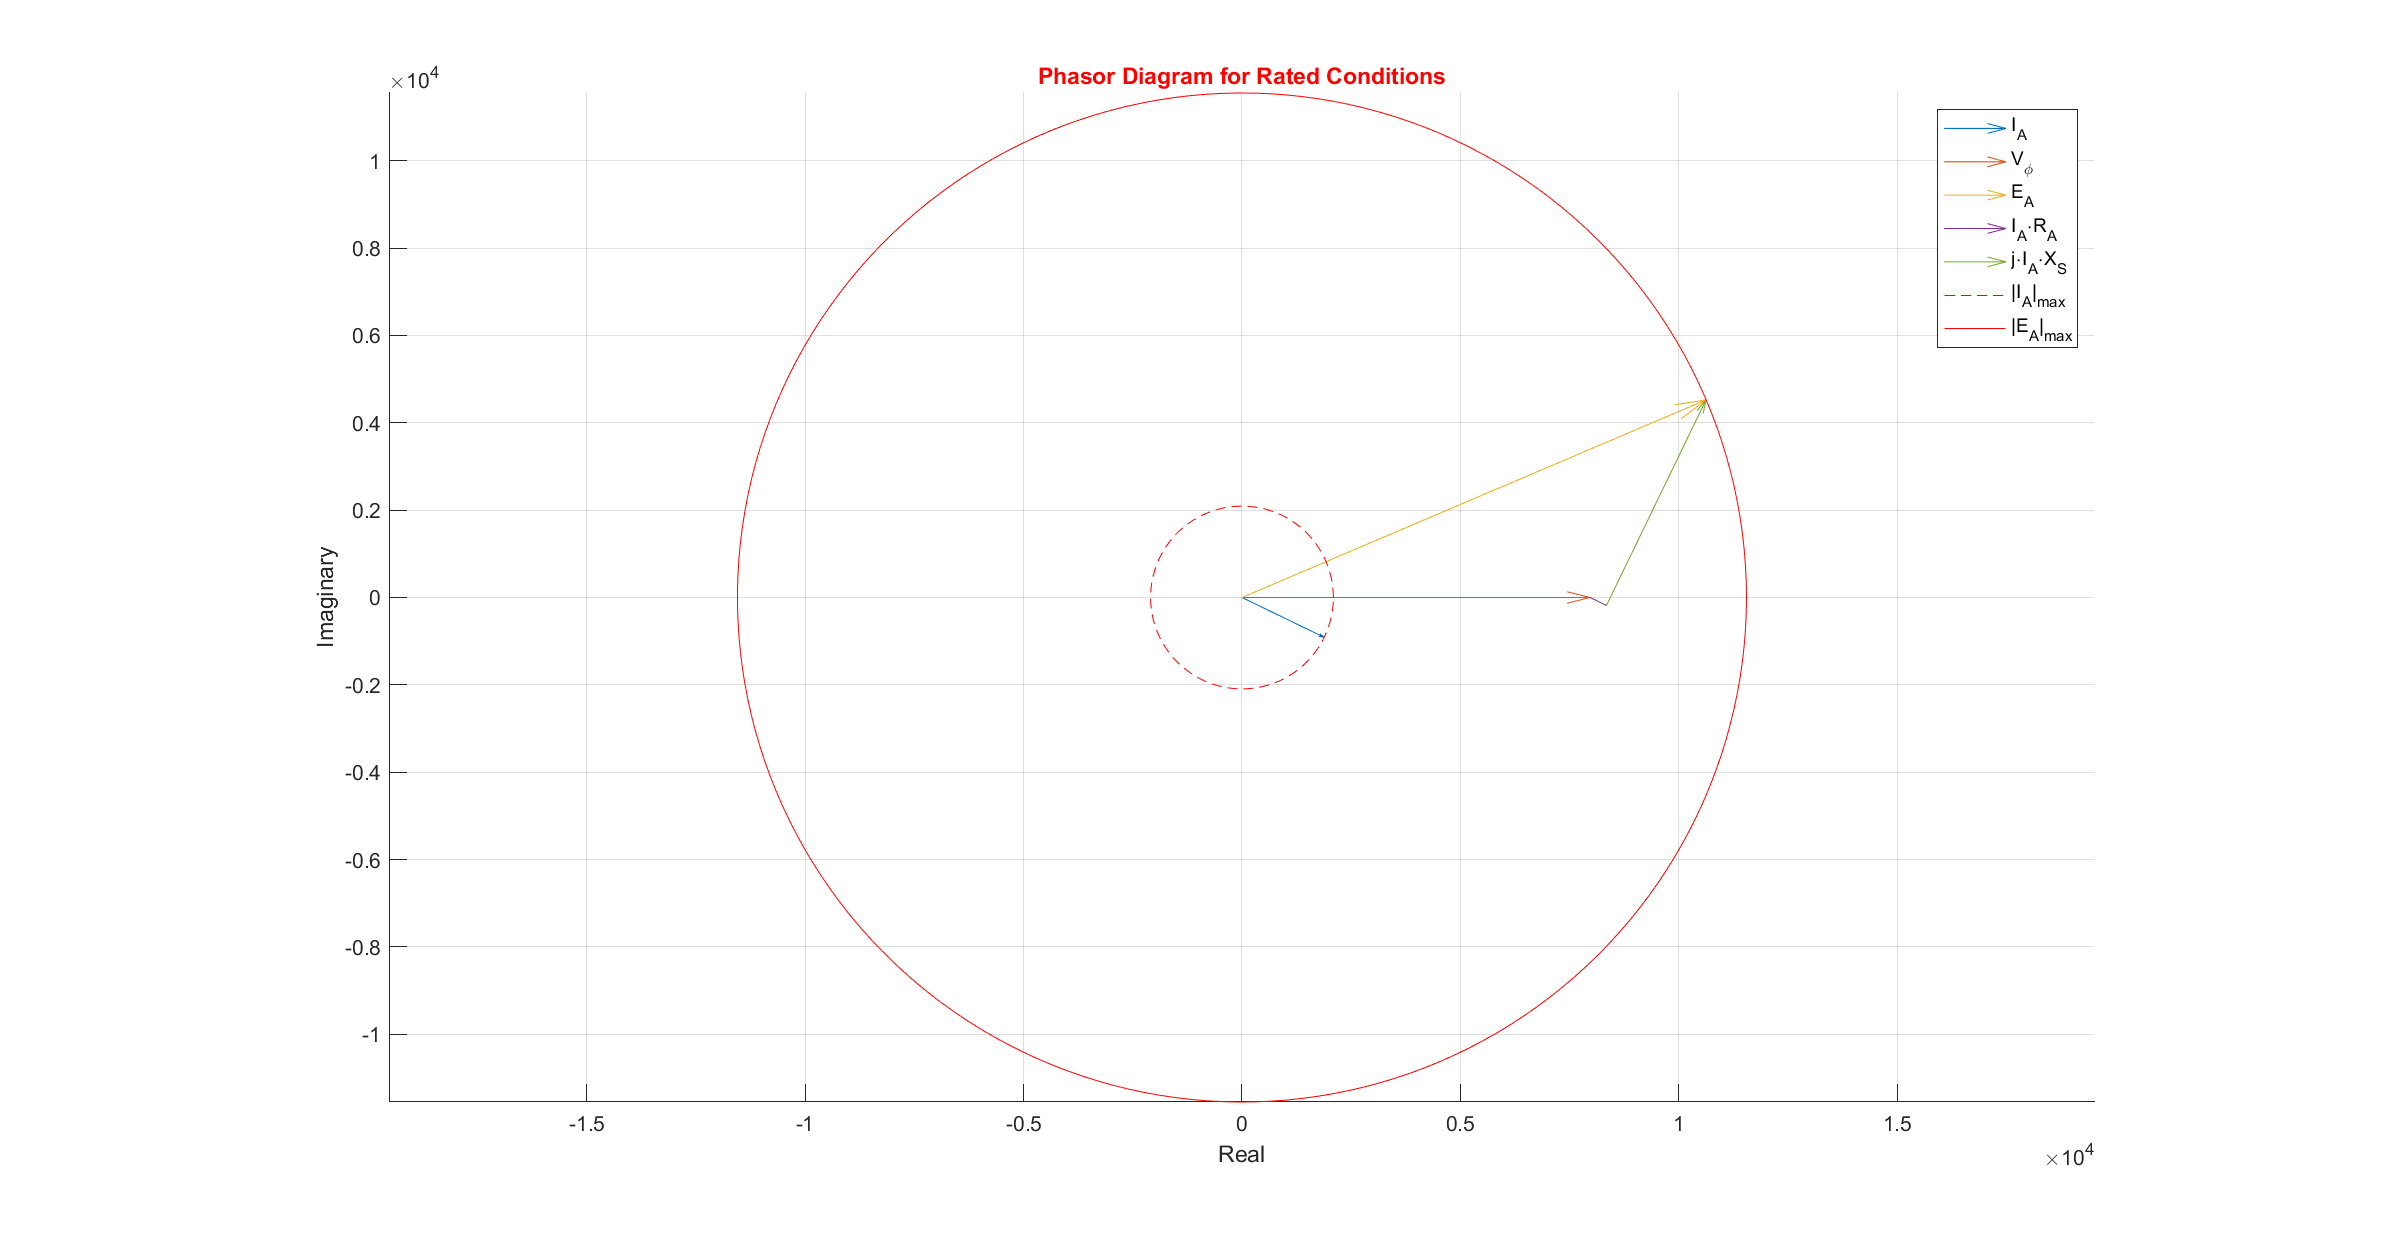
2. At rated conditions, compute and provide  and . Explain briefly in your report theoretical calculations. For rated conditions plot the phasor diagram and limit circles of the appropriate variables in red. Include the plot in the report.
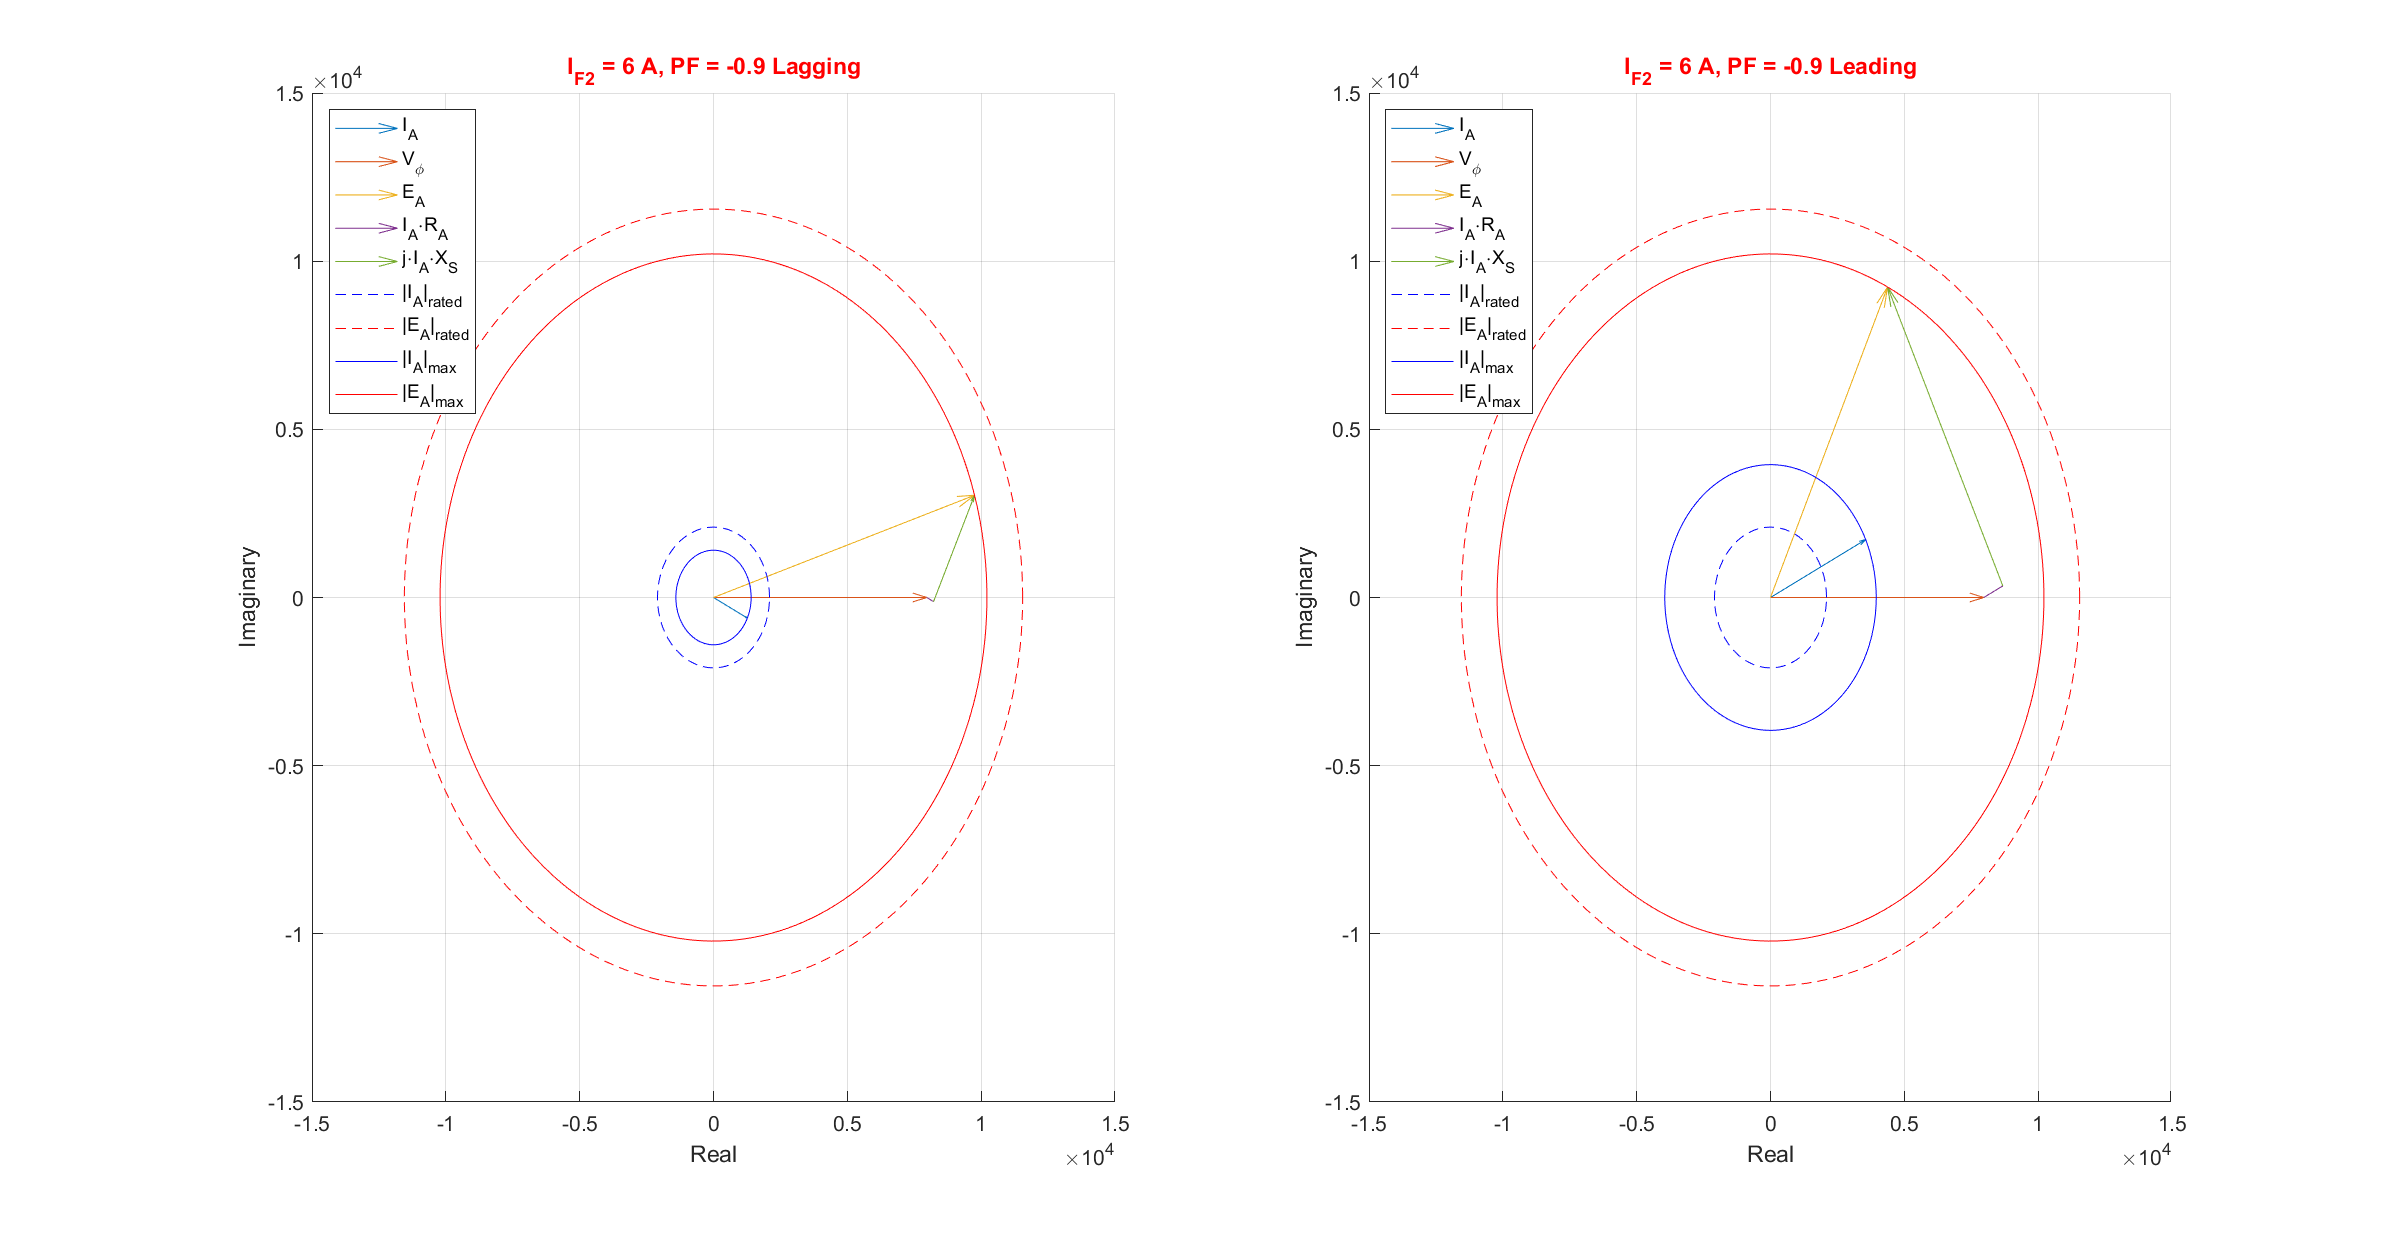
3. For this part, assume that the terminal voltage remains at the rated values described in the question. Create a new plot that contains the red limit circles. In this new figure, using different colors, the plot for 0.9–power–factor–lagging and 0.9–power–factor–leading  limit circles corresponding to  = 2 A and  = 6 A as well as the phasors of relevant quantities.
4. For each case when varying power factors and  provide in the report a short analysis of generator behavior in terms of active and reactive power by observing the plots you created.
## Plots
### Phasor Diagram
### Lagging/Leading Power Factor (PF)
## Author
👤 **Aras Güngöre**
* LinkedIn: [@arasgungore](https://www.linkedin.com/in/arasgungore)
* GitHub: [@arasgungore](https://github.com/arasgungore)