https://github.com/ardata-fr/shinytools
https://github.com/ardata-fr/shinytools
Last synced: 4 months ago
JSON representation
- Host: GitHub
- URL: https://github.com/ardata-fr/shinytools
- Owner: ardata-fr
- License: other
- Archived: true
- Created: 2019-04-05T08:22:55.000Z (over 6 years ago)
- Default Branch: master
- Last Pushed: 2019-11-12T21:23:58.000Z (about 6 years ago)
- Last Synced: 2024-08-13T07:15:34.776Z (over 1 year ago)
- Language: R
- Size: 139 KB
- Stars: 19
- Watchers: 3
- Forks: 3
- Open Issues: 0
-
Metadata Files:
- Readme: README.Rmd
- Changelog: NEWS.md
- License: LICENSE
Awesome Lists containing this project
- jimsghstars - ardata-fr/shinytools - (R)
README
---
output: github_document
---
```{r setup, include = FALSE}
knitr::opts_chunk$set(
collapse = TRUE,
comment = "#>",
fig.path = "man/figures/README-",
out.width = "100%"
)
```
# shinytools
 shinytools brings some minor but important features in shiny applications by providing
simple JavaScript functions to make interactions with the DOM easier and modules
to perform data importation and data filtering in shiny applications.
The first motivation of shinytools is to gather and share codes written by [ArData](https://www.ardata.fr)
when building Shiny applications.
## JavaScript functions
The package is providing JavaScript bindings for common and useful operations as `shiny` utilities :
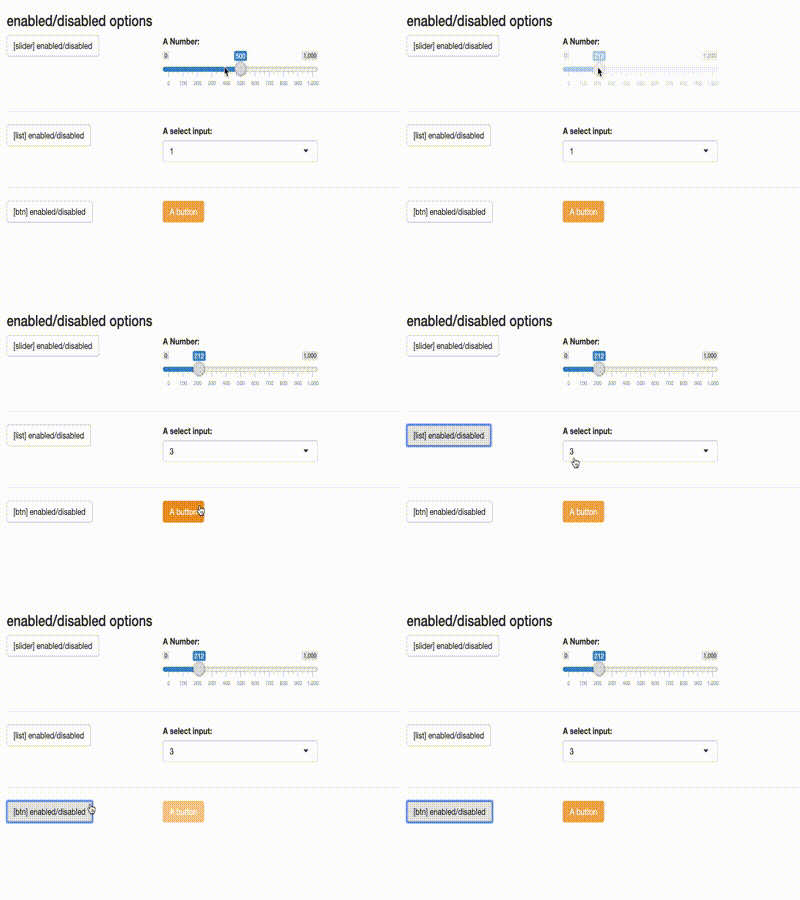
* disable or enable a shiny control: `ability()`, `html_disable()`, `html_enable()`, `default_disabled()`
* display or hide an HTML element: `html_toogle()`, `html_set_visible()`, `html_set_hidden()`
* set or unset active state for a button: `activate()`, `html_set_active()`, `html_set_inactive()`
* create a reactive value from a click event: `click_event`
* add or remove a class: `html_class()`, `html_addclass()`, `html_unclass()`
## Simple shiny modules
The package also provides some of the modules we use :
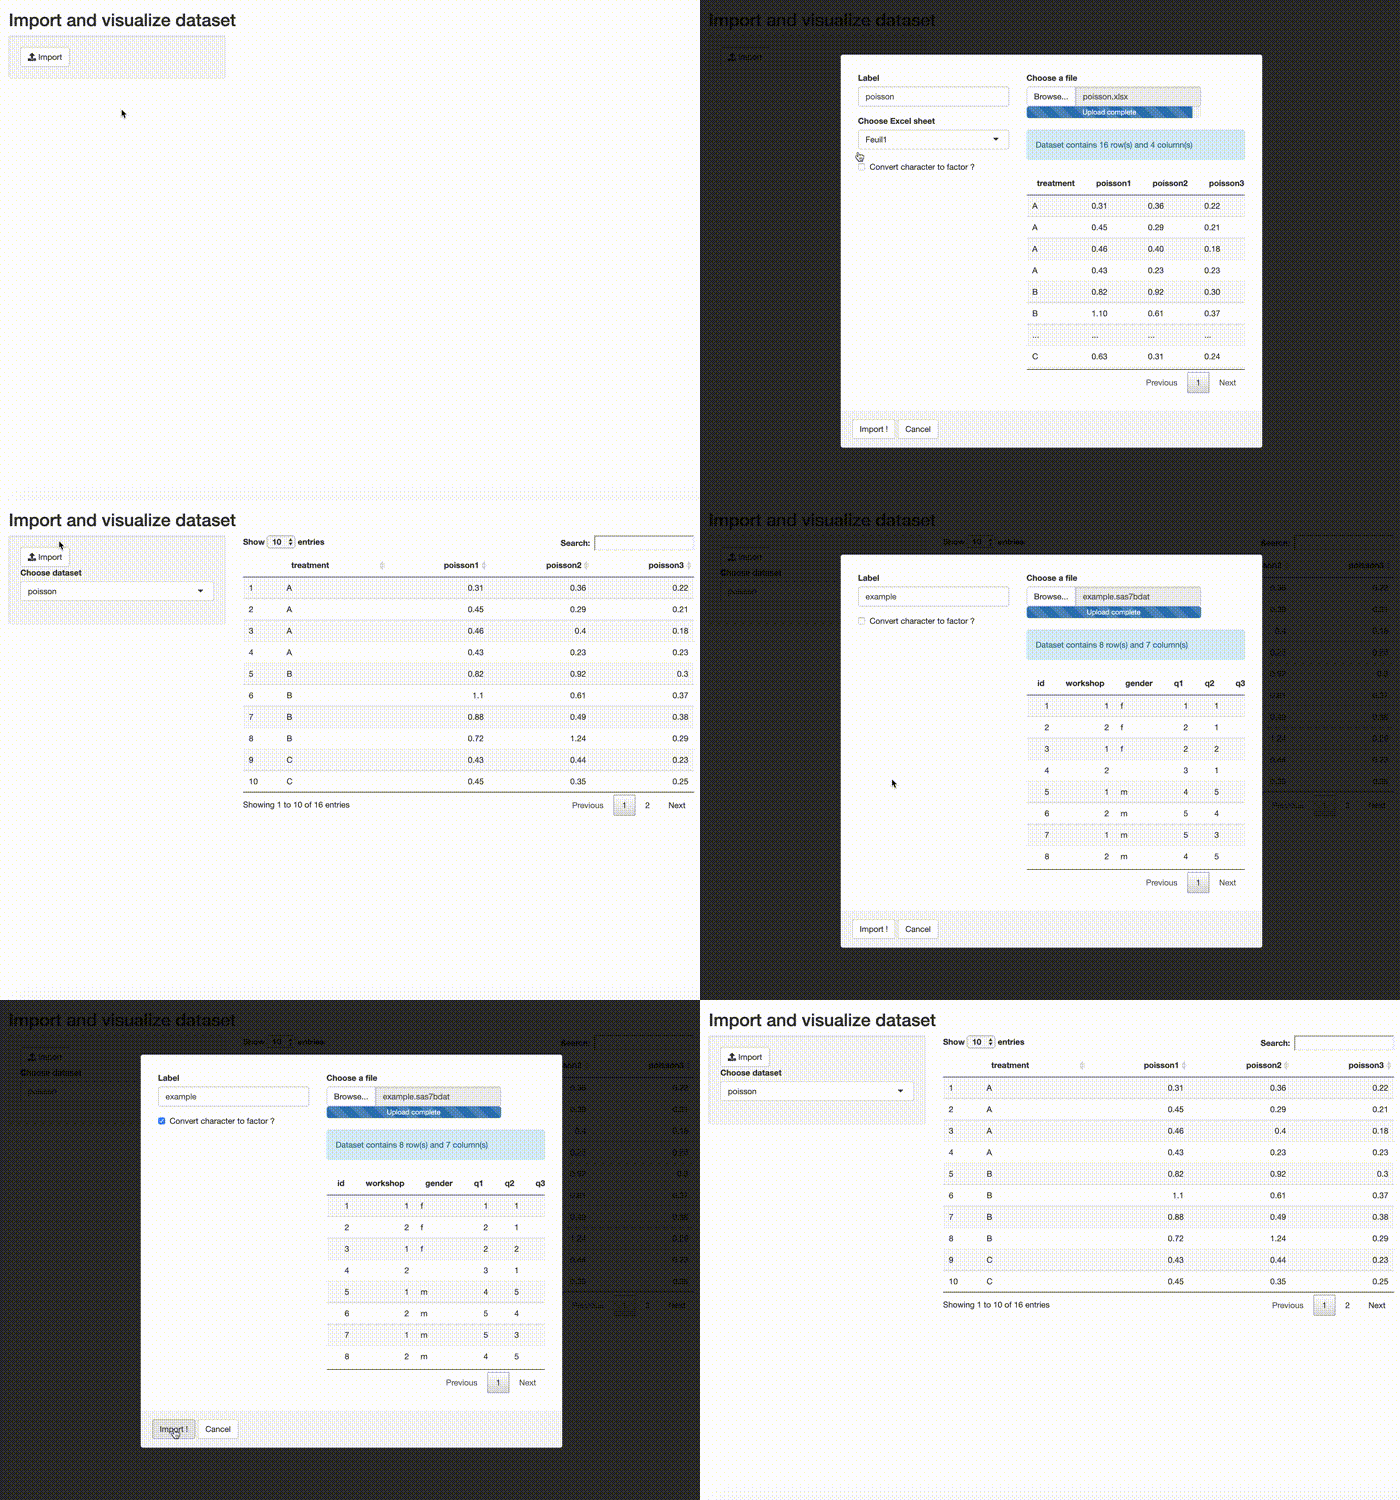
* A tool for data importation: `importDataUI` & `importDataServer`
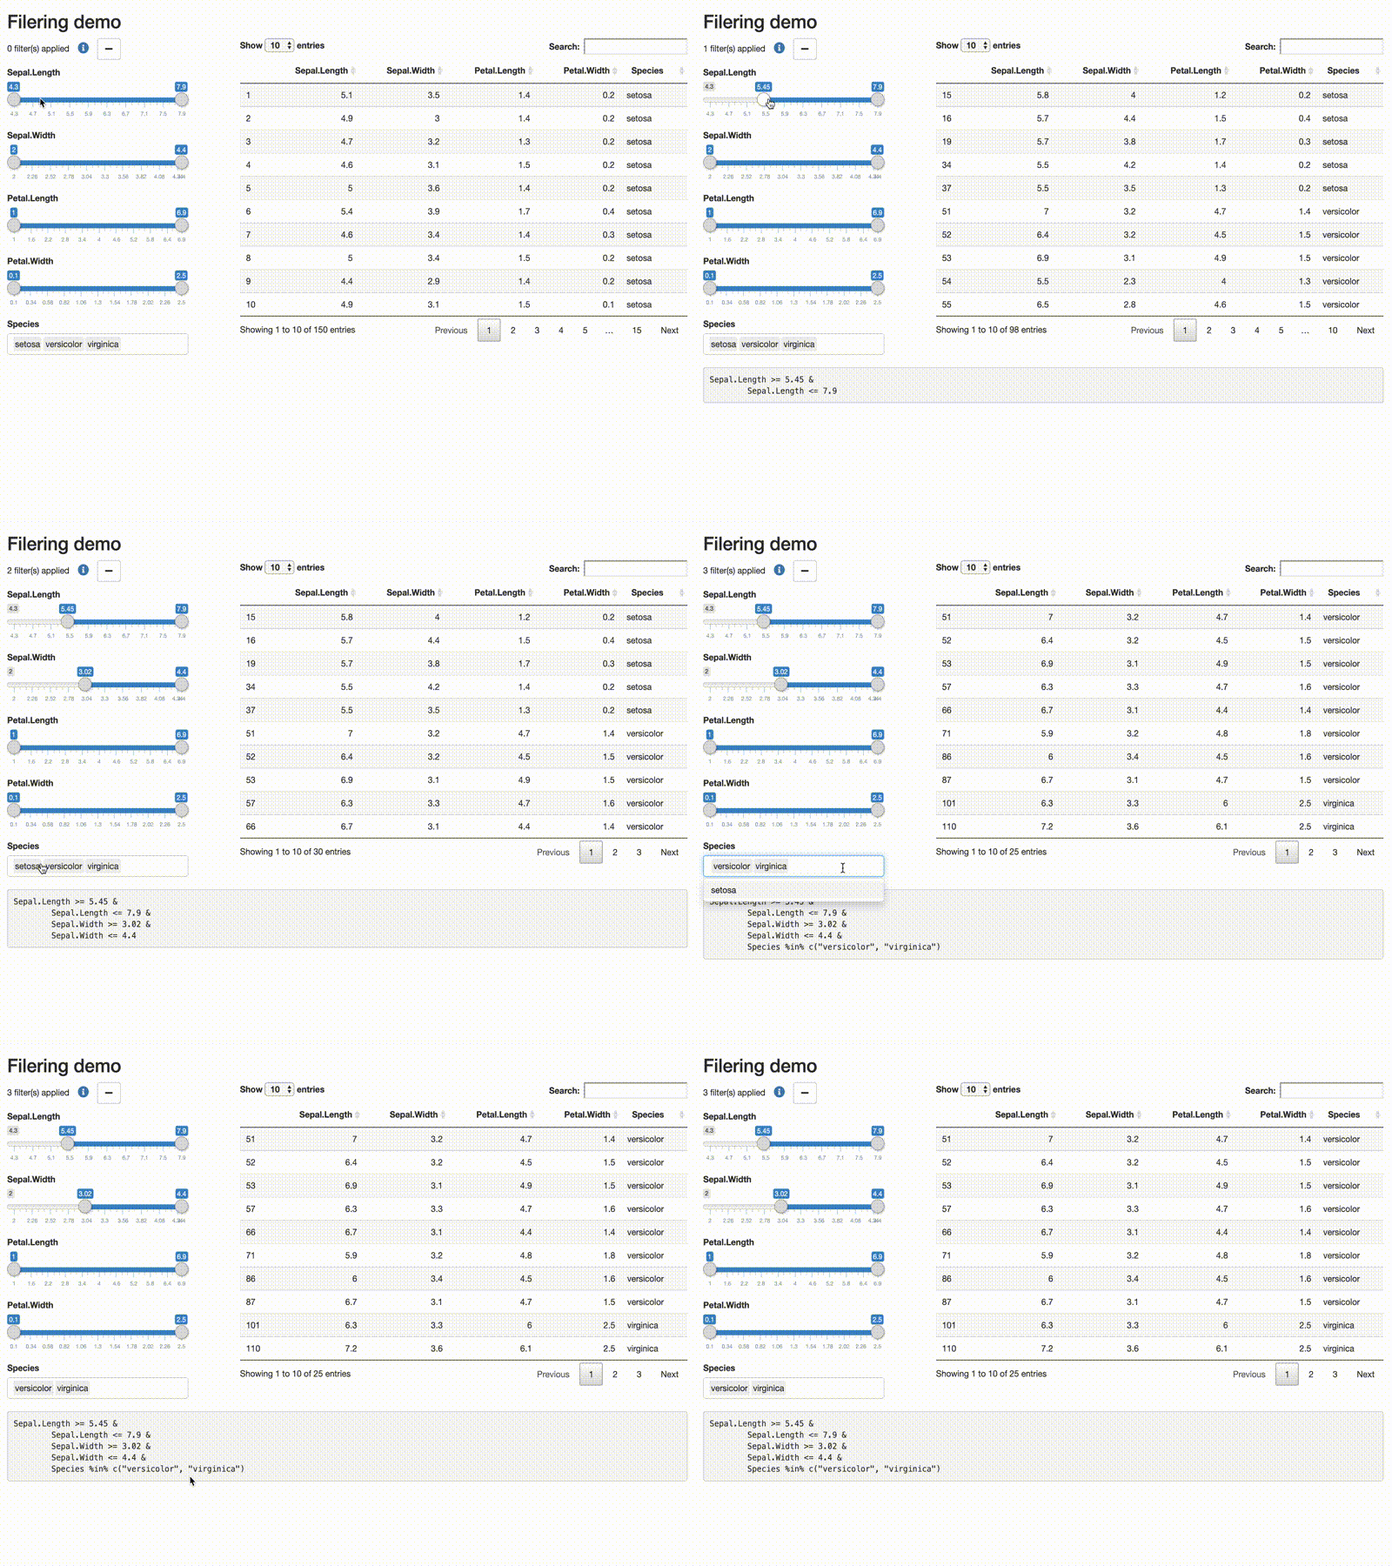
* A tool for data filtering: `filterDataUI` & `filterDataServer`
## Installation
``` r
# install.packages("remotes")
remotes::install_github("ardata-fr/shinytools")
```
## Example
### Disable inputs

``` r
library(shiny)
library(shinytools)
if (interactive()) {
ui <- fluidPage(
load_jstools(),
fluidRow(column(width = 12, h3("enabled/disabled options"))),
fluidRow(
column(width = 3,
actionButton(inputId = "able_slider",
label = "[slider] enabled/disabled") ),
column(width = 5,
sliderInput( "slider",
"A Number:",
min = 0, max = 1000, value = 500)
)
),
hr(),
fluidRow(
column(width = 3,
actionButton(inputId = "able_select",
label = "[list] enabled/disabled")),
column(width = 5,
selectizeInput("select", "A select input:", 1:5)
)
),
hr(),
fluidRow(
column(width = 3,
actionButton(inputId = "able_btn",
label = "[btn] enabled/disabled")),
column(width = 5,
actionButton("btn", "A button", class = "btn-warning")
)
)
)
server <- function(input, output) {
observeEvent(input$able_slider, {
ability("slider", input$able_slider%%2 < 1)
})
observeEvent(input$able_btn, {
ability("btn", input$able_btn%%2 < 1)
})
observeEvent(input$able_select, {
ability("select", input$able_select%%2 < 1)
})
}
print(shinyApp(ui, server))
}
```
### Import data

``` r
if (interactive()) {
options(device.ask.default = FALSE)
ui <- fluidPage(
titlePanel("Import and visualize dataset"),
sidebarLayout(
sidebarPanel(
load_tingle(),
importDataUI(id = "id1"),
uiOutput("dataset_labels")
),
mainPanel(
DT::dataTableOutput(outputId = "id2")
)
)
)
server <- function(input, output) {
all_datasets <- reactiveValues()
datasets <- callModule(
module = importDataServer,
id = "id1", ui_element = "actionButton",
labelize = TRUE,
forbidden_labels = reactive(names(reactiveValuesToList(all_datasets))))
observeEvent(datasets$trigger, {
req(datasets$trigger > 0)
all_datasets[[datasets$name]] <- datasets$object
})
output$dataset_labels <- renderUI({
x <- reactiveValuesToList(all_datasets)
if (length(x) > 0) {
selectInput("SI_labels", label = "Choose dataset", choices = names(x))
}
})
output$id2 <- DT::renderDataTable({
req(input$SI_labels)
all_datasets[[input$SI_labels]]
})
}
print(shinyApp(ui, server))
}
```
### Filter data

``` r
library(shiny)
library(DT)
library(shinytools)
if (interactive()) {
options(device.ask.default = FALSE)
ui <- fluidPage(
fluidRow(column(width=12, h2("Filering demo"))),
fluidRow(
column(
width = 4,
filterDataUI(id = "demo")
),
column(width = 8,
DT::dataTableOutput(outputId = "subsetdata")
)
),
fluidRow(
column(width = 12,
verbatimTextOutput(outputId = "expr")
)
)
)
server <- function(input, output, session) {
res <- callModule(module = filterDataServer,
id = "demo", x = reactive(iris),
return_data = TRUE)
output$expr <- renderText({
req(res)
if(res$filtered){
expr_str <- format(res$expr)
expr_str <- paste( gsub("^[ ]+", "", expr_str), collapse = "")
gsub("\\&[ ]*", "&\n\t", expr_str, fixed = FALSE)
} else NULL
})
output$subsetdata <- DT::renderDataTable({
res$filtered_data
})
}
print(shinyApp(ui, server))
}
```
If you set the parameter `return_data = FALSE` then you can evaluate the returned call as follow :
``` r
# With base R
filters <- eval(expr = res$expr, envir = iris)
# With lazyeval
filters <- lazyeval::lazy_eval(res$expr, data = iris)
# With rlang
filters <- rlang::eval_tidy(res$expr, data = iris)
# Then subset data.frame
iris[filters,]
```