https://github.com/arjuncodess/astroscope
https://github.com/arjuncodess/astroscope
Last synced: 9 months ago
JSON representation
- Host: GitHub
- URL: https://github.com/arjuncodess/astroscope
- Owner: ArjunCodess
- License: mit
- Created: 2025-08-04T11:49:15.000Z (11 months ago)
- Default Branch: main
- Last Pushed: 2025-08-04T14:52:04.000Z (11 months ago)
- Last Synced: 2025-08-04T17:05:38.042Z (11 months ago)
- Language: Python
- Homepage: https://astroscope.streamlit.app/
- Size: 25.4 KB
- Stars: 1
- Watchers: 0
- Forks: 0
- Open Issues: 0
-
Metadata Files:
- Readme: README.md
- License: LICENSE
Awesome Lists containing this project
README
# 🔭 AstroScope: NASA Asteroid Dashboard
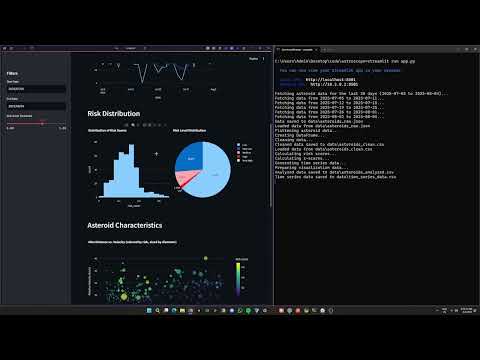
AstroScope is an interactive dashboard that visualizes near-Earth asteroid data from NASA's NeoWs API. It provides insights into asteroid sizes, velocities, miss distances, and potential hazards.
## 📋 Features
- **Data Fetching**: Automatically fetches asteroid data from NASA's NeoWs API
- **Data Analysis**: Calculates risk scores, identifies anomalies, and generates time series data
- **Interactive Dashboard**: Visualizes asteroid data with interactive charts and tables
- **Filtering**: Filter data by date range and risk threshold
- **Risk Heatmap Calendar**: GitHub-style calendar heatmap of daily average risk scores
- **Daily Closest Miss Table**: Ranks the top 10 dates by the closest asteroid approach, with details per day
- **Responsive Design**: Works on desktop and mobile devices
## 🚀 Getting Started
### Prerequisites
- Python 3.7 or higher
- NASA API key (get one at [https://api.nasa.gov](https://api.nasa.gov))
### Getting a NASA API Key
1. Go to [https://api.nasa.gov](https://api.nasa.gov).
2. In the "Generate API Key" form, fill in the required fields:
- First Name (required)
- Last Name (required)
- Email (required)
- How will you use the APIs? (optional)
3. Submit the form and check your email to receive your API key.
4. Add the key to your `.env` file:
```
NASA_API_KEY="YOUR_KEY_HERE"
```
### Installation
1. Clone the repository:
```bash
git clone https://github.com/ArjunCodess/astroscope.git
cd astroscope
```
2. Install dependencies:
```bash
pip install -r requirements.txt
```
3. Duplicate the `.env.example` file to create a `.env` file in the project root directory and update the `NASA_API_KEY` with your own key:
```
NASA_API_KEY=""
```
### Configuration
The application can be configured using environment variables in the `.env` file:
- `NASA_API_KEY`: Your NASA API key (required)
- `DATA_FETCH_DAYS`: Number of days to fetch asteroid data for (default: 30)
- `DATA_DIR`: Directory to store data files (default: "data")
- `API_CHUNK_SIZE`: Maximum number of days per API request (default: 7, NASA API limit)
- `RISK_THRESHOLD`: Threshold for classifying asteroids as high risk (default: 0.6)
## 📊 Running the Application
Start the Streamlit dashboard with a single command:
```bash
python -m streamlit run app.py
```
The dashboard will be available at [http://localhost:8501](http://localhost:8501).
The application will automatically:
1. Check if data files exist
2. If not, fetch asteroid data from NASA's NeoWs API
3. Process the raw data into a clean format
4. Analyze the data to calculate risk scores and generate time series data
5. Display the interactive dashboard
- Includes a "Daily Closest Miss" table showing the closest approach per day and ranking the top 10 dates by proximity
> **Note**: You can still run the data pipeline steps separately if needed:
> - `python -m lib.data_fetcher` - Fetch data only
> - `python -m lib.data_processing` - Process data only
> - `python -m lib.analysis` - Analyze data only
## 📁 Project Structure
- `app.py`: Main Streamlit application
- `lib/`: Library modules
- `data_fetcher.py`: Fetches data from NASA's NeoWs API
- `data_processing.py`: Processes raw data into clean format
- `analysis.py`: Analyzes data and calculates risk scores
- `visualizer.py`: Creates visualizations for the dashboard
- `data/`: Data directory (created automatically)
- `docs/`: Documentation
- `PRD.md`: Product Requirements Document
## 📄 License
This project is licensed under the MIT License - see the LICENSE file for details.