https://github.com/arkanivasarkar/rnaseq-data-analysis-pipeline
Pipeline for analyzing RNAseq data of human and mouse - beginner friendly with minimal user inputs
https://github.com/arkanivasarkar/rnaseq-data-analysis-pipeline
bioinformatics differential-gene-expression rna-seq rna-seq-pipeline
Last synced: 2 months ago
JSON representation
Pipeline for analyzing RNAseq data of human and mouse - beginner friendly with minimal user inputs
- Host: GitHub
- URL: https://github.com/arkanivasarkar/rnaseq-data-analysis-pipeline
- Owner: arkanivasarkar
- Created: 2021-08-30T16:23:41.000Z (over 3 years ago)
- Default Branch: main
- Last Pushed: 2021-08-30T18:35:20.000Z (over 3 years ago)
- Last Synced: 2025-02-01T21:32:20.428Z (4 months ago)
- Topics: bioinformatics, differential-gene-expression, rna-seq, rna-seq-pipeline
- Language: R
- Homepage:
- Size: 1.52 MB
- Stars: 0
- Watchers: 1
- Forks: 1
- Open Issues: 0
-
Metadata Files:
- Readme: README.md
Awesome Lists containing this project
README
# RNAseq Data Analysis Pipeline
This repository contains the workflow of RNAseq data analysis.
This pipeline performs the following tasks:
- Reading data
- align reads of each sample in a run against reference genome
= perform quality control on generated BAM files
- count reads in features
- normalize read counts
- Filtering lowly expressed genes
- perform DE analysis
## Dataset
The data used for analysis is from the study, “EGF-mediated induction of Mcl-1 at the switch to lactation is essential for alveolar cell survival” (Fu et al. 2015).
This study examines the expression profiles of basal stem-cell enriched cells and committed luminal cells in the mammary gland of virgin, pregnant and lactating mice.
GEO Accession ID - [GSE60450](https://www.ncbi.nlm.nih.gov/geo/query/acc.cgi?acc=GSE60450)
The read count data, metadata and the fastq files are present in `Datasets` folder.
## Results
The differentially expressed genes were obtained.
Various plots like heatmap, mean-variance plot, MA plot, and volcano plot were made to analyse the data better.
### Library Size of the Samples
[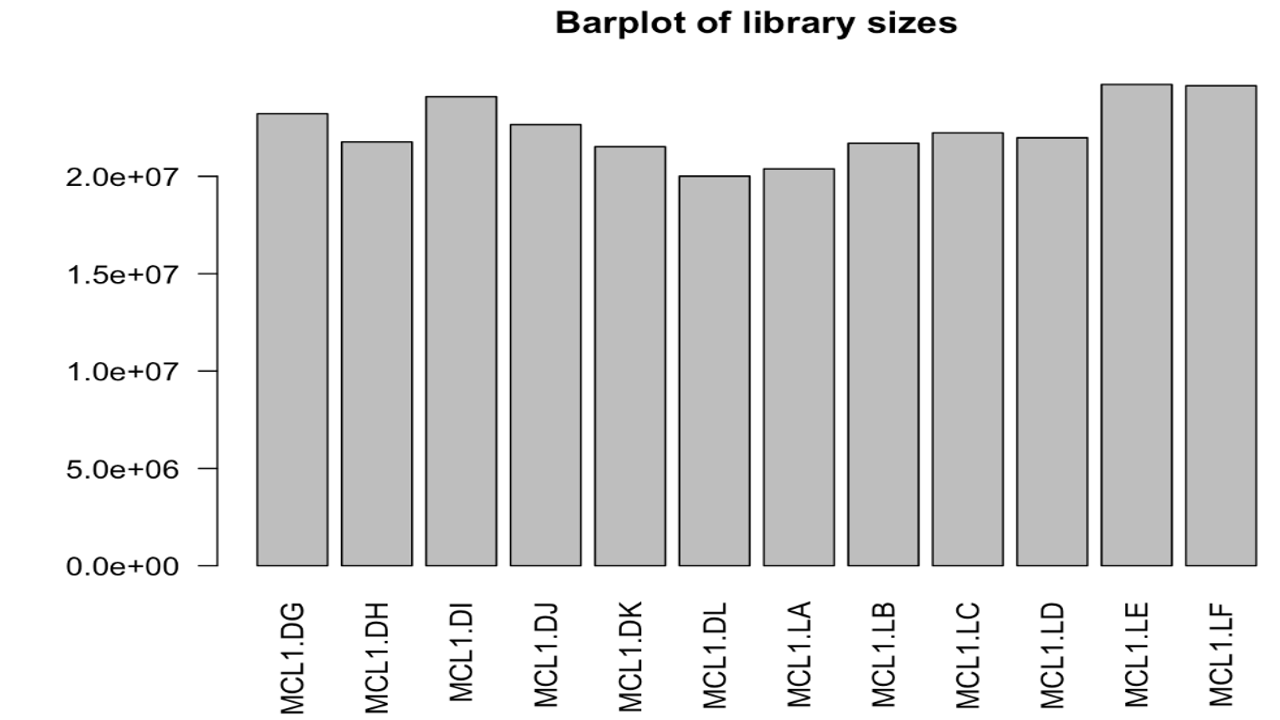](https://postimg.cc/0rn6tsrt)
### HeatMap
[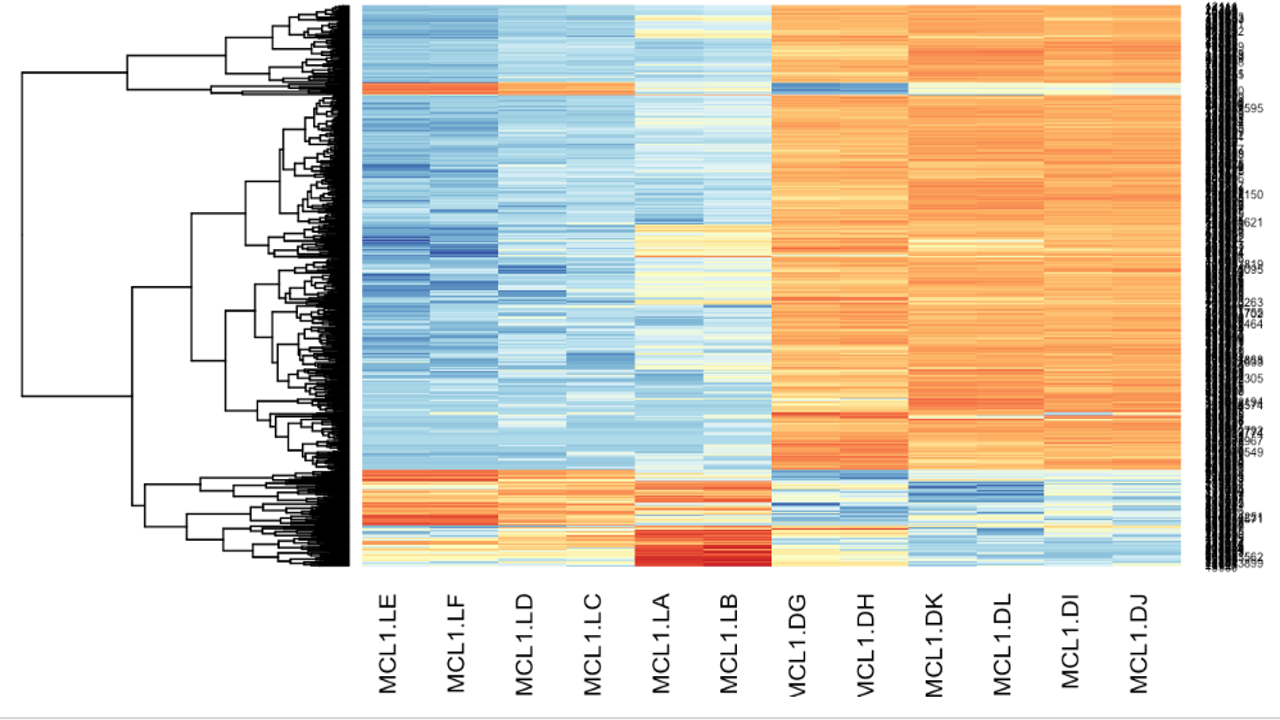](https://postimg.cc/w31Kr5jS)
### Mean-Variance Plot
[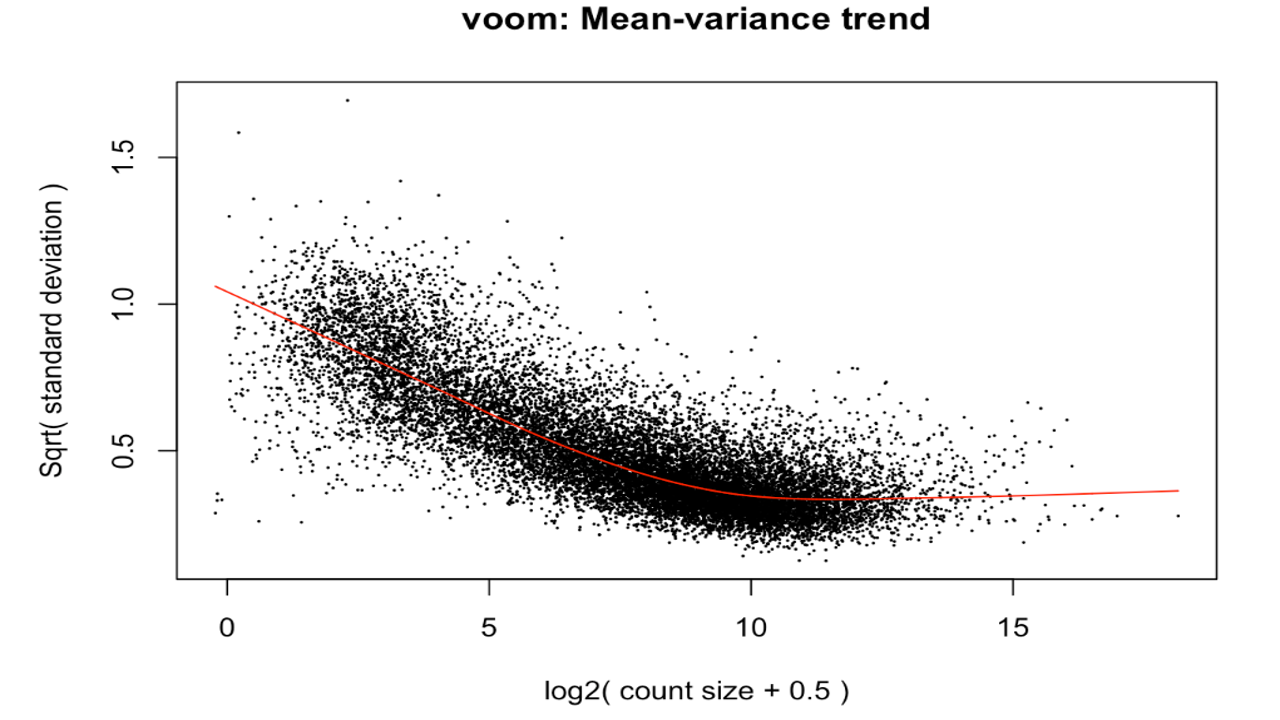](https://postimg.cc/ygBdPQK4)
### MA Plot & Volcano Plot
[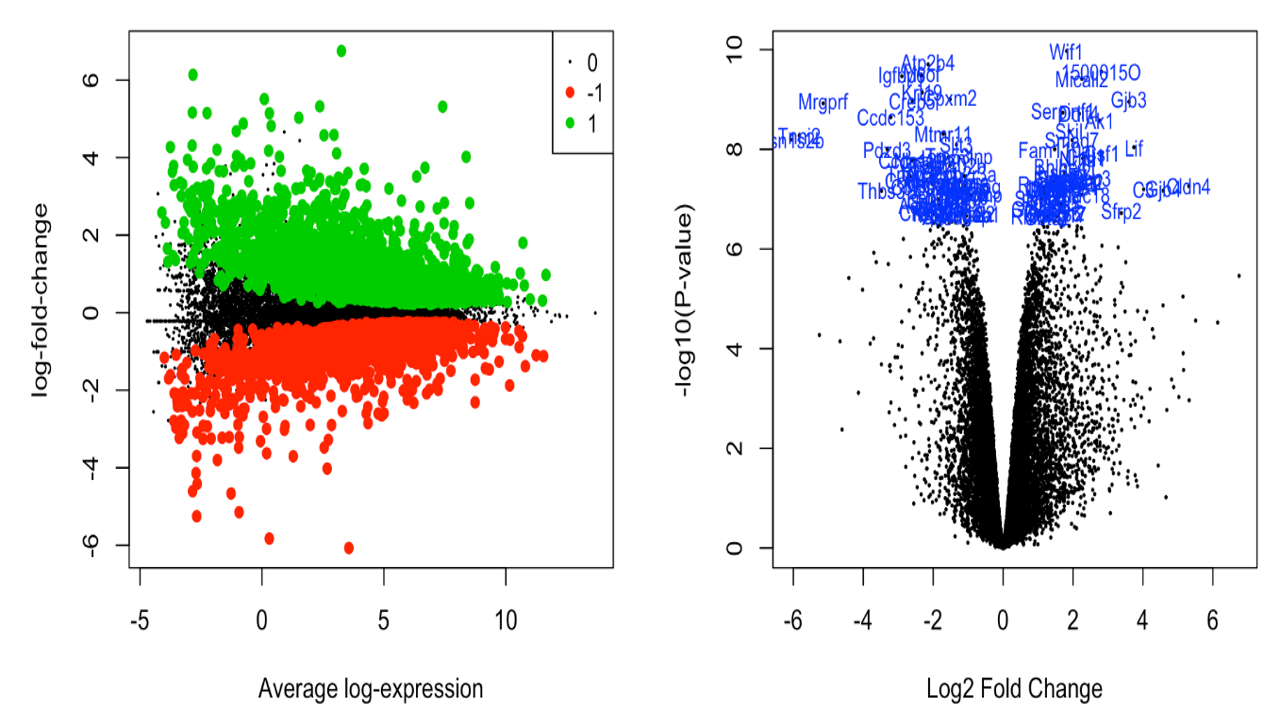](https://postimg.cc/7CXvFm7y)