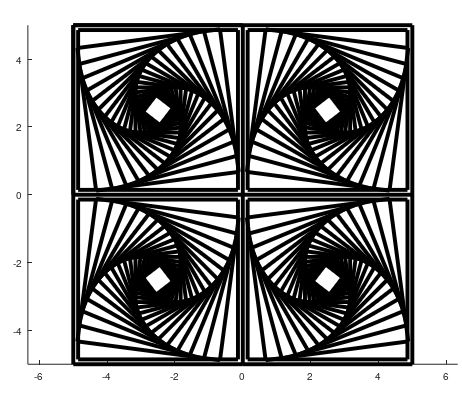
https://github.com/armanx200/regular-polygon-spiral
This MATLAB script generates Regular Polygon Spiral drawings with customizable parameters such as the number of sides, figure center, radius, iteration count, angle distribution, color, and direction. It utilizes the GNU General Public License for distribution and modification.
https://github.com/armanx200/regular-polygon-spiral
arman-kianian matlab octave popular popular-repositories project regular-polygon regular-polygon-spiral trending-repositories trending-topics trends
Last synced: 6 months ago
JSON representation
This MATLAB script generates Regular Polygon Spiral drawings with customizable parameters such as the number of sides, figure center, radius, iteration count, angle distribution, color, and direction. It utilizes the GNU General Public License for distribution and modification.
- Host: GitHub
- URL: https://github.com/armanx200/regular-polygon-spiral
- Owner: Armanx200
- License: gpl-3.0
- Created: 2024-04-24T15:20:09.000Z (over 1 year ago)
- Default Branch: main
- Last Pushed: 2024-05-03T17:28:07.000Z (over 1 year ago)
- Last Synced: 2024-11-24T09:16:35.624Z (11 months ago)
- Topics: arman-kianian, matlab, octave, popular, popular-repositories, project, regular-polygon, regular-polygon-spiral, trending-repositories, trending-topics, trends
- Language: MATLAB
- Homepage: https://github.com/Armanx200
- Size: 216 KB
- Stars: 9
- Watchers: 1
- Forks: 0
- Open Issues: 0
-
Metadata Files:
- Readme: README.md
- License: LICENSE
Awesome Lists containing this project
README
          🎨 Animated Polygon Generator 🌀

This MATLAB script generates animated polygon drawings with customizable parameters such as the number of sides, figure center, radius, iteration count, angle distribution, color, and direction. It utilizes the GNU General Public License for distribution and modification. ✨


### Features:

- Generate animated polygon drawings with varying properties. 🖼️

- Customizable parameters for number of sides, figure center, radius, iteration count, angle distribution, color, and direction. 🛠️

- Utilizes MATLAB's plotting capabilities for dynamic visualizations. 🌈

### Usage:

1️⃣ Define parameters like number of sides, figure center, radius, etc.

2️⃣ Call the `Polygon` function with desired parameters to generate animated polygons.

3️⃣ Customize colors, direction, and other visual aspects for diverse animations. 🎥

### Example:

```matlab

NUM_SIDES = 4;

PLOT_SIZE = 10;

HOW_MANY_TIMES = 10;

color = 'k'; % Default color is black

direction = {'l','r','d','l'};  % ltr rtl dtb ltr

fig_center = {[n,n], [-n,n], [n,-n], [-n,-n]};

angle_dist = HOW_MANY_TIMES/6;

% Plot

figure;

hold on;

plot(x_bordar, y_bordar, 'black', 'LineWidth', 2);

for i=1:4

    Polygon(NUM_SIDES, fig_center{i}, PLOT_SIZE/3, HOW_MANY_TIMES, angle_dist, color, direction{i});

end

```

Arman Kianian