https://github.com/arshc0der/n.o.v.a-geospatial-ozone-predictor
An AI-powered geospatial intelligence dashboard for predicting atmospheric ozone levels using 27 years of NASA data. Features 3D climate mapping and live satellite tracking.
https://github.com/arshc0der/n.o.v.a-geospatial-ozone-predictor
atmospheric-science climate-tech dashboard-ui data-visualization desktop-app geospatial-analysis gis machine-learning matplotlib ozone-prediction pandas python random-forest-regressor satellite-tracking scikit-learn tkinter windows-executable
Last synced: 4 months ago
JSON representation
An AI-powered geospatial intelligence dashboard for predicting atmospheric ozone levels using 27 years of NASA data. Features 3D climate mapping and live satellite tracking.
- Host: GitHub
- URL: https://github.com/arshc0der/n.o.v.a-geospatial-ozone-predictor
- Owner: arshc0der
- Created: 2026-02-03T22:39:19.000Z (4 months ago)
- Default Branch: main
- Last Pushed: 2026-02-28T23:17:47.000Z (4 months ago)
- Last Synced: 2026-02-28T23:44:04.925Z (4 months ago)
- Topics: atmospheric-science, climate-tech, dashboard-ui, data-visualization, desktop-app, geospatial-analysis, gis, machine-learning, matplotlib, ozone-prediction, pandas, python, random-forest-regressor, satellite-tracking, scikit-learn, tkinter, windows-executable
- Language: Python
- Homepage:
- Size: 48.6 MB
- Stars: 0
- Watchers: 0
- Forks: 0
- Open Issues: 0
-
Metadata Files:
- Readme: README.md
Awesome Lists containing this project
README
# 🌍 N.O.V.A. — Geospatial Ozone Predictor
> An advanced atmospheric intelligence platform using NASA data (1994–2021), Stochastic Machine Learning, and Real-Time Telemetry.


---
# 📌 Overview
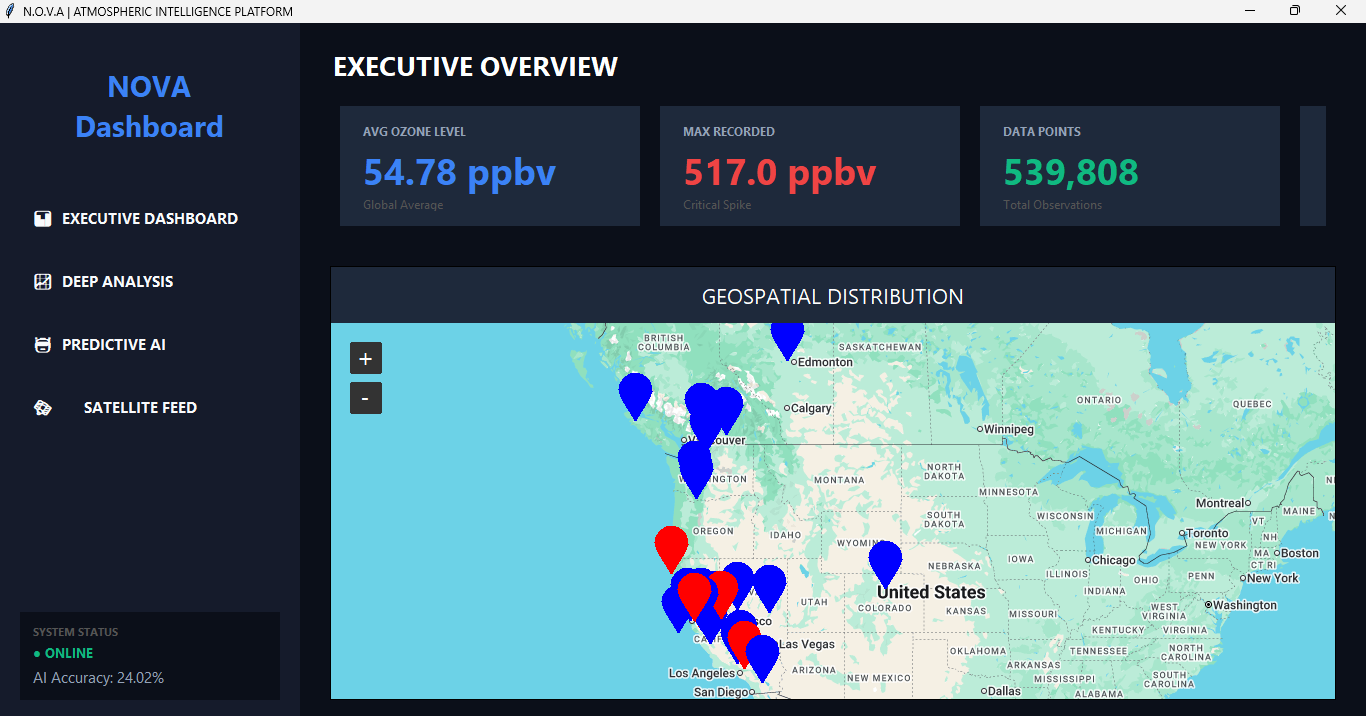
**N.O.V.A. (North American Ozone Visual Analytics)** is a Mission Control–style atmospheric intelligence system designed to analyze, visualize, and predict stratospheric and tropospheric Ozone (O₃) concentrations across Western North America.
It transforms nearly 30 years of NASA atmospheric back-trajectory data into an interactive desktop dashboard combining:
- 📊 Historical Geospatial Visualization
- 🤖 Random Forest Machine Learning Prediction
- 🛰️ Real-Time ISS Telemetry Tracking
---
# ✨ Core Features
| Feature | Description |
|----------|-------------|
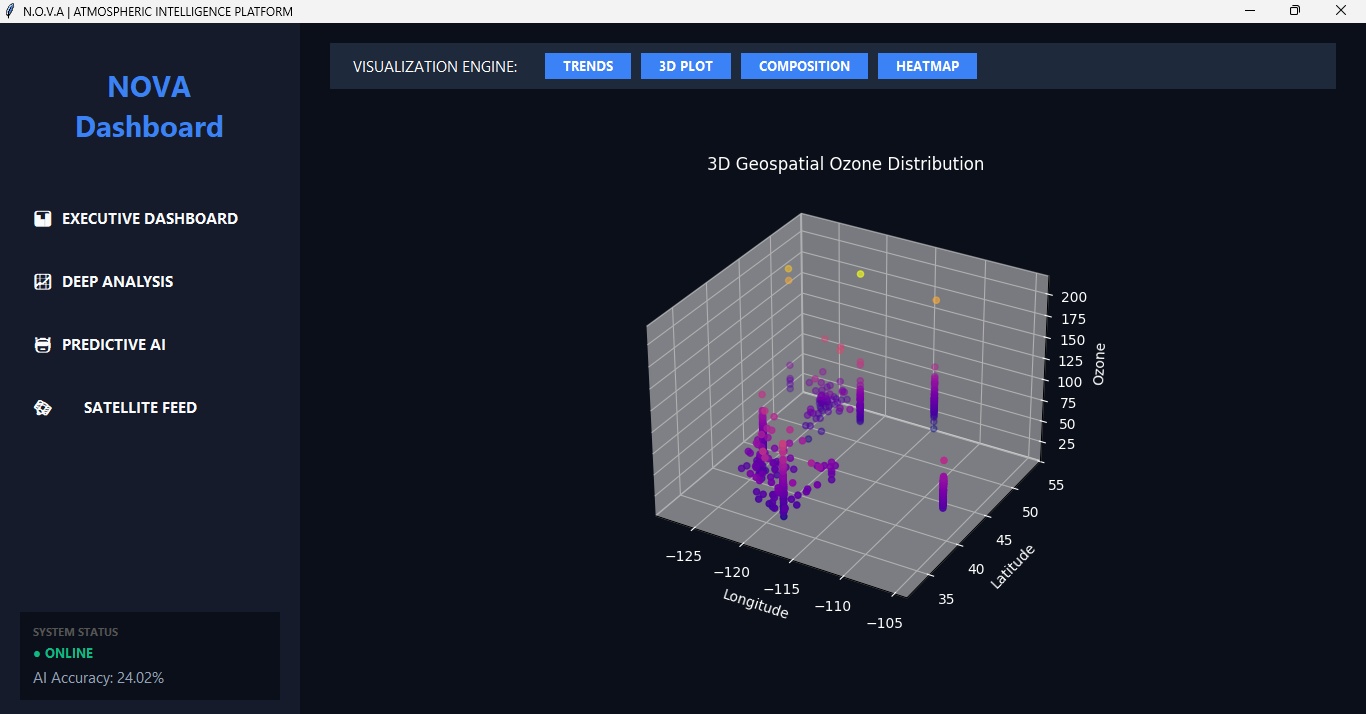
| 🌌 **3D Geospatial Visualization** | Interactive 3D atmospheric ozone distribution |
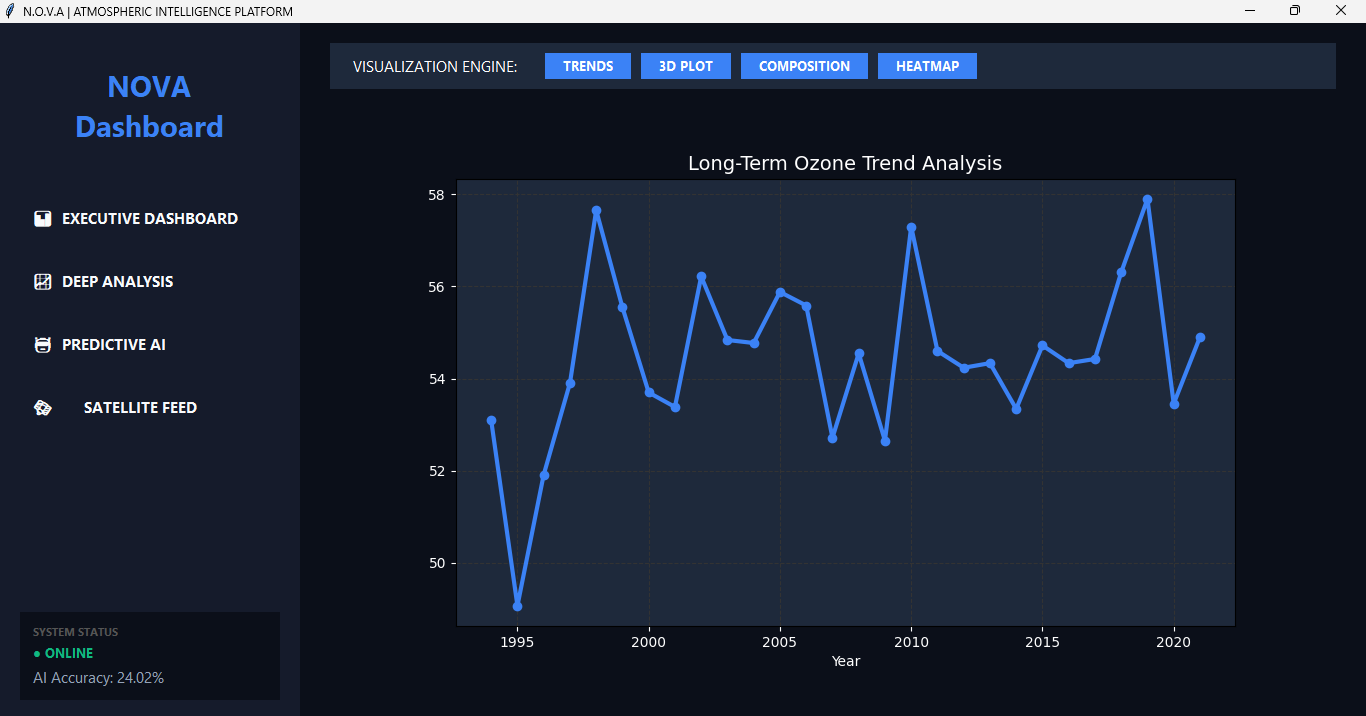
| 📈 **Trend Analysis** | Historical line graph and seasonal analysis |
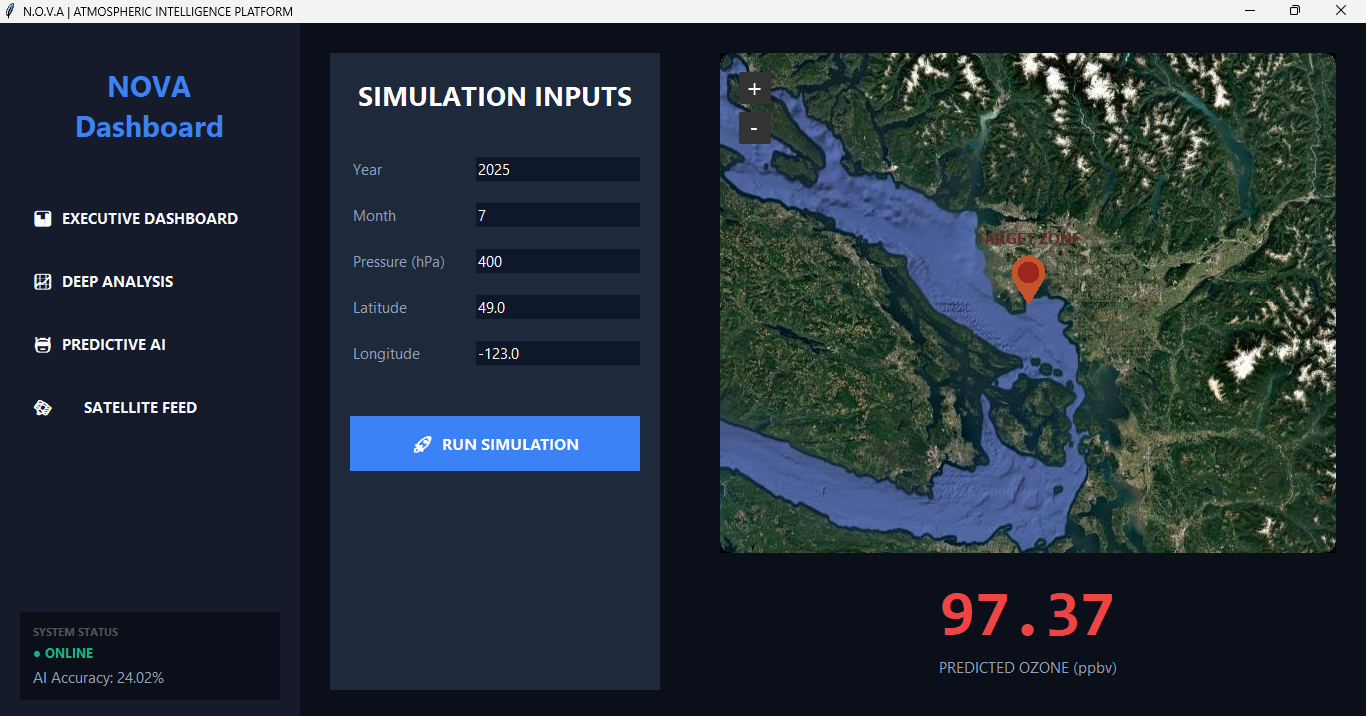
| 🤖 **AI Prediction Engine** | 50-tree Random Forest Regressor |
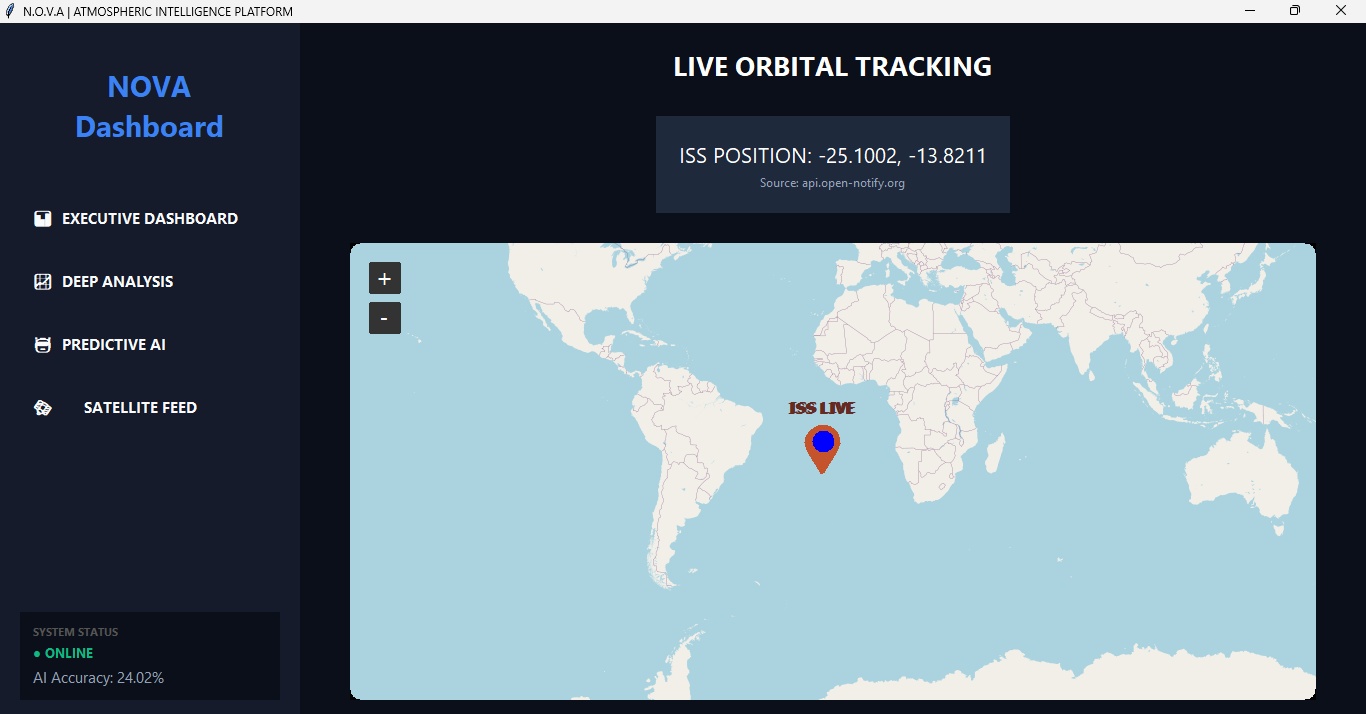
| 🛰️ **Live ISS Tracker** | Real-time satellite telemetry via API |
| 🎛️ **Mission Control UI** | Dark cyber-corporate themed interface |
---
# 🖼 UI Preview
## 1️⃣ Dashboard
---
## 2️⃣ 3D Visualization
---
## 3️⃣ Line Graph Analysis
---
## 4️⃣ AI Prediction Engine
---
## 5️⃣ Live Satellite Location (ISS Tracking)
---
# 🧠 Data Science & AI Logic
### 📥 Independent Variables (Features)
- Pressure (hPa) — Represents altitude
- Latitude
- Longitude
- Month
- Year
### 📤 Dependent Variable (Target)
- Ozone Concentration (ppbv)
---
### 🤖 Model Details
- Algorithm: **Random Forest Regressor**
- Trees: 50 (`n_estimators=50`)
- Train/Test Split: 80/20
- Typical R² Score: **0.85 – 0.94**
- Most Influential Feature: **Pressure (Altitude)**
Random Forest was selected because atmospheric ozone behavior is non-linear and seasonal, making linear regression insufficient.
---
# 🛰️ Real-Time Telemetry
The ISS tracking system:
- Fetches live coordinates from a public API
- Updates every 3 seconds
- Runs in a background thread
- Prevents UI freezing using multithreading
---
# 🏗 Architecture
N.O.V.A. follows the **Model–View–Controller (MVC)** pattern:
| Layer | Role |
|--------|------|
| Model | Data processing & AI engine |
| View | Tkinter GUI interface |
| Controller | User-triggered simulation & visualization logic |
---
# 🛠 Installation & Setup
## 🔹 1. Clone Repository
```bash
git clone https://github.com/arshc0der/N.O.V.A-Geospatial-Ozone-Predictor.git
cd N.O.V.A-Geospatial-Ozone-Predictor
````
---
## 🔹 2. Create Virtual Environment (Recommended)
```bash
python -m venv venv
```
### Windows
```bash
venv\Scripts\activate
```
### macOS / Linux
```bash
source venv/bin/activate
```
---
## 🔹 3. Install Dependencies
```bash
pip install -r requirements.txt
```
---
## 🔹 4. Ensure Dataset File Exists
Place this file in the root directory:
```
Receptor_western_NAmerica_ozone_obs_1994_2021_from900to300.csv
```
---
## 🔹 5. Run Application
```bash
python app.py
```
---
# 📦 requirements.txt
```
pandas
numpy
scikit-learn
matplotlib
seaborn
requests
tkintermapview
```
---
# 🤝 Contributing
1. Fork the repository
2. Create a feature branch
3. Commit changes
4. Submit a Pull Request
---
# 📜 License
Distributed under the **MIT License**.
© 2026 Arsh
---
### 🚀 Built using NASA atmospheric back-trajectory data.