https://github.com/arvind-4/streamify-dashboard
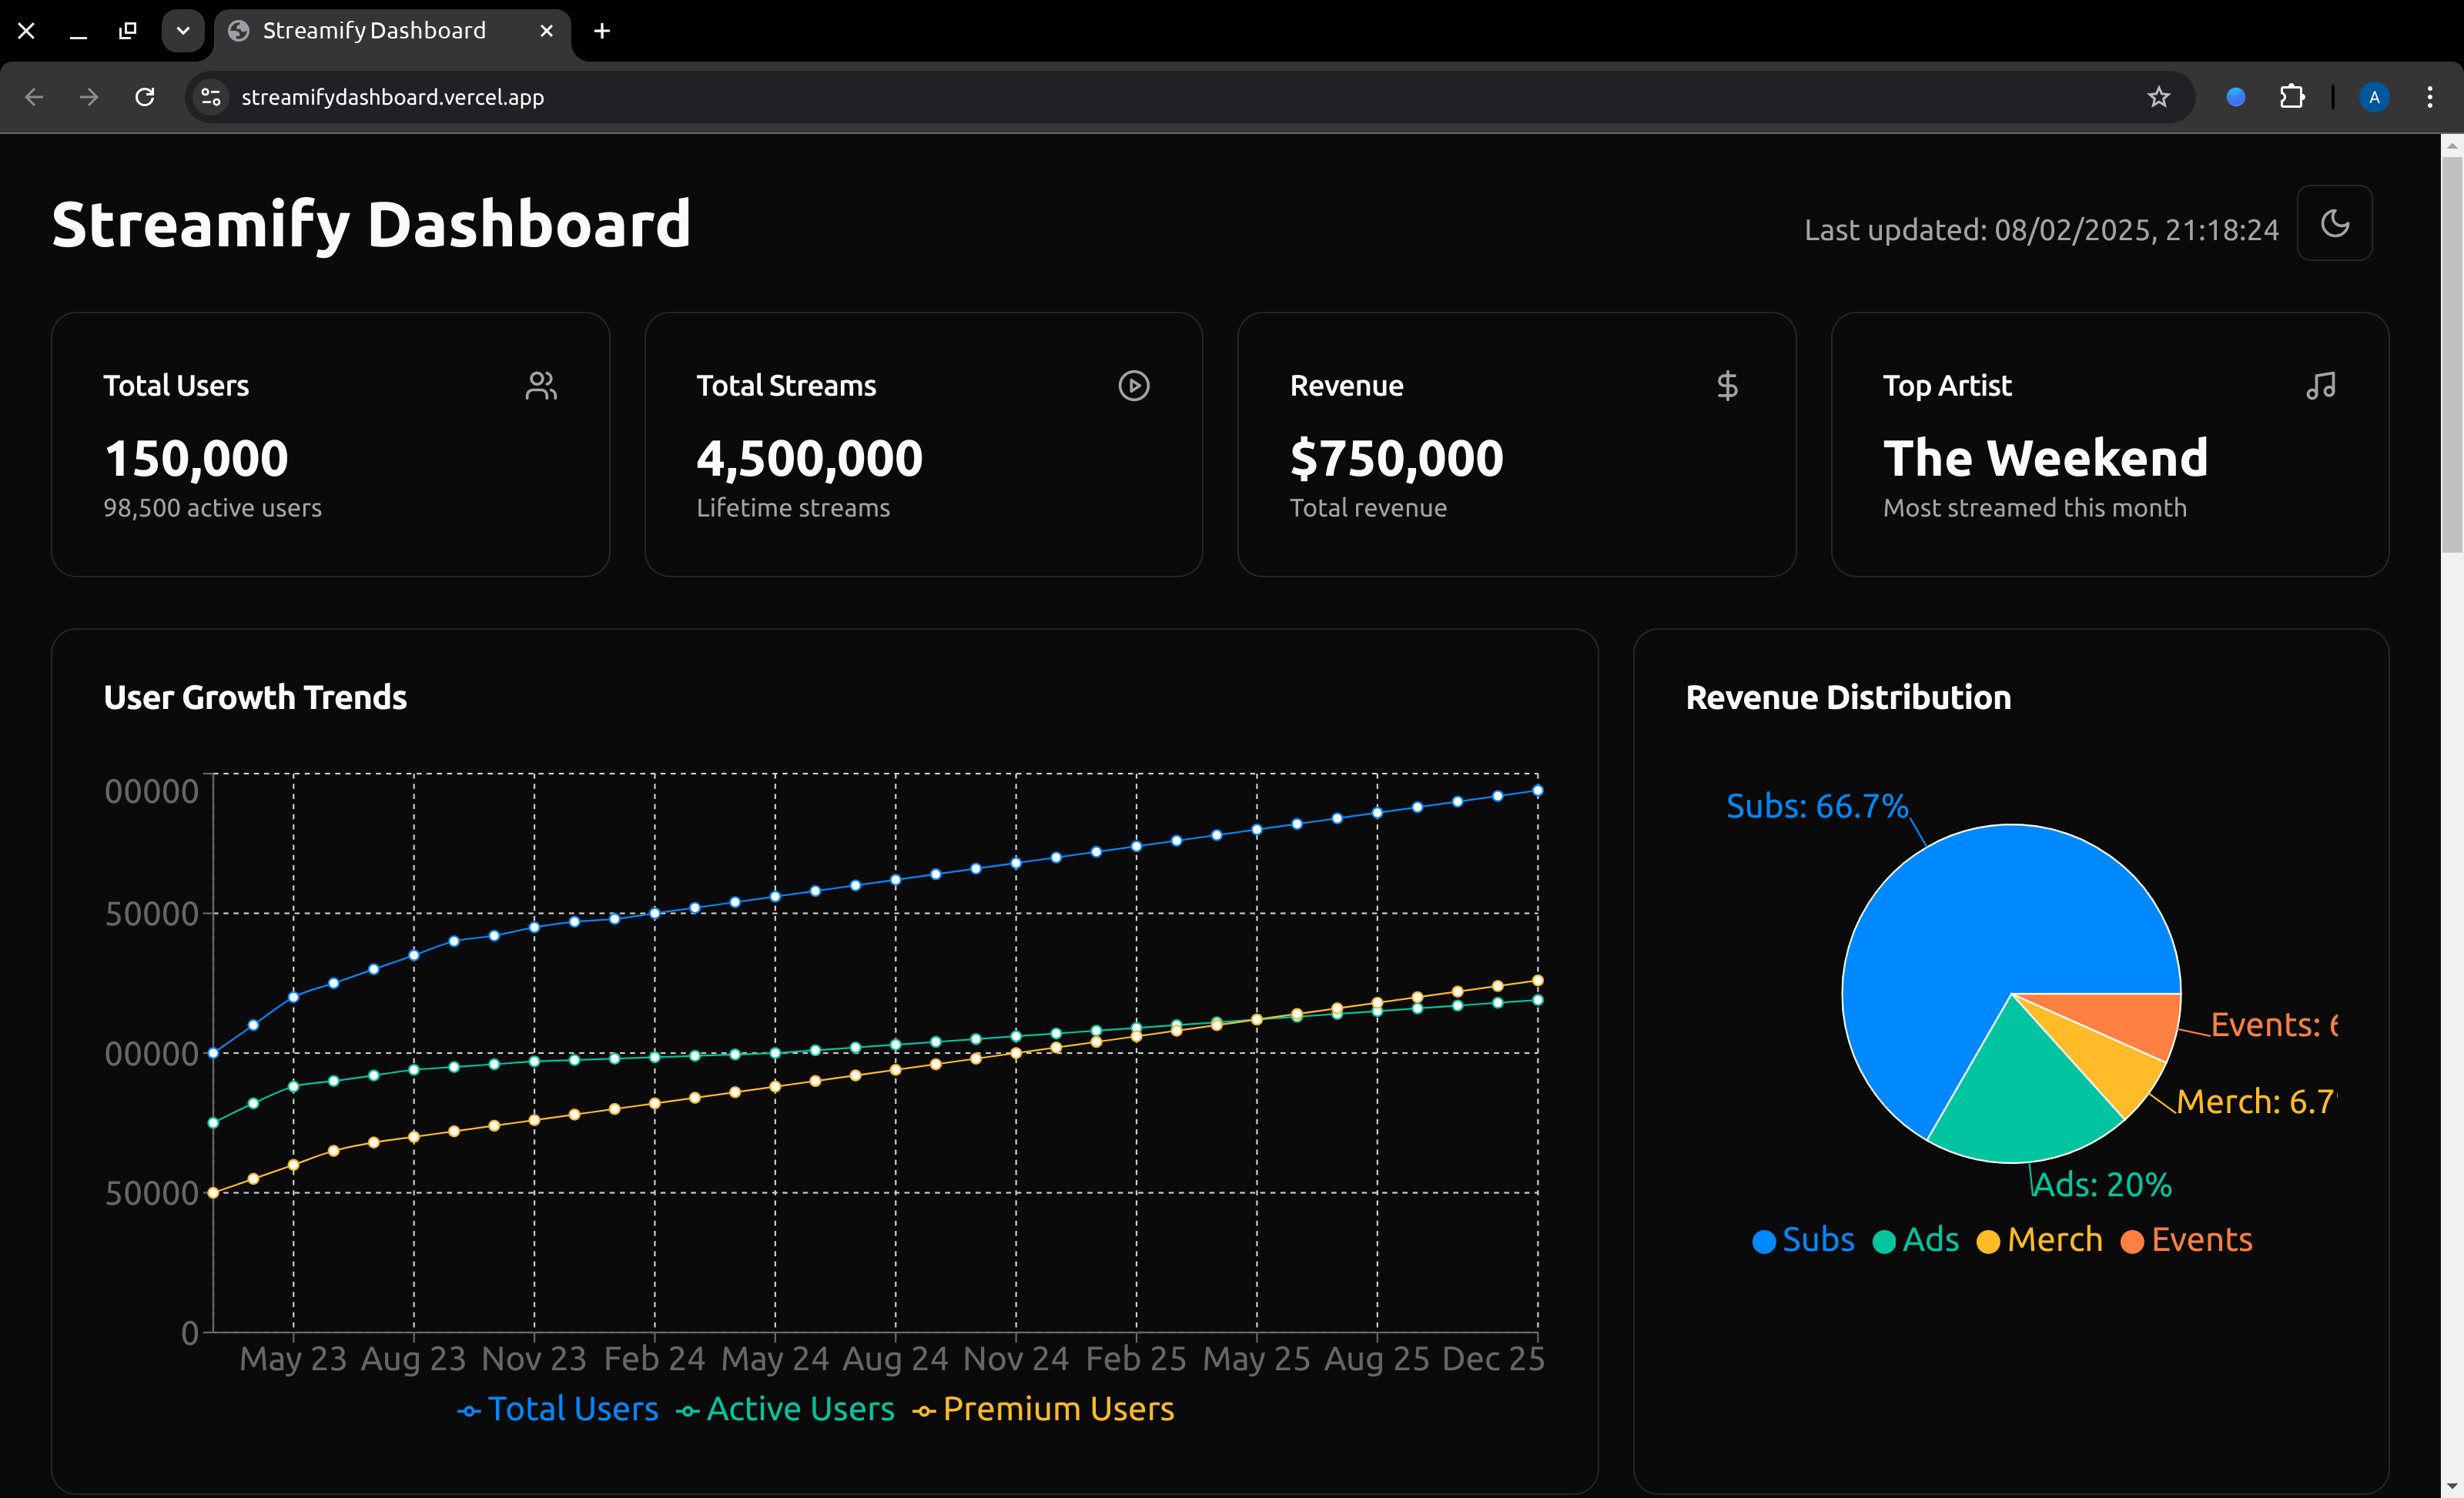
A dashboard with bar charts, pie charts, and a table.
https://github.com/arvind-4/streamify-dashboard
dashboard reactjs shadcn-ui typescript vercel
Last synced: 3 months ago
JSON representation
A dashboard with bar charts, pie charts, and a table.
- Host: GitHub
- URL: https://github.com/arvind-4/streamify-dashboard
- Owner: arvind-4
- License: mit
- Created: 2025-02-08T15:40:33.000Z (over 1 year ago)
- Default Branch: main
- Last Pushed: 2025-02-08T16:04:08.000Z (over 1 year ago)
- Last Synced: 2025-07-08T06:04:47.935Z (about 1 year ago)
- Topics: dashboard, reactjs, shadcn-ui, typescript, vercel
- Language: TypeScript
- Homepage: https://streamifydashboard.vercel.app/
- Size: 434 KB
- Stars: 0
- Watchers: 1
- Forks: 0
- Open Issues: 0
-
Metadata Files:
- Readme: README.md
- License: LICENSE
Awesome Lists containing this project
README
# streamify-dashboard
A dashboard with bar charts, pie charts, and a table visually presents data. Bar charts compare categories, pie charts show proportions, and tables provide detailed data. Together, they offer both high-level overviews and in-depth insights for better analysis and decision-making.
## Screenshots
## Run it locally
- Clone the project
```bash
mkdir cd ~/Dev/streamify-dashboard -p
cd ~/Dev/streamify-dashboard
git clone https://github.com/arvind-4/streamify-dashboard.git .
```
- Go to the project directory
```bash
cd ~/Dev/streamify-dashboard
```
Install dependencies
```bash
pnpm install
```
Start the server
```bash
pnpm dev
```
## Running Tests
To run tests, run the following command
```bash
pnpm test
```
## Deployment
To deploy this project run
```bash
pnpm build
```
open the `dist/index.html` file in your browser
## Authors
[@Arvind](https://www.github.com/arvind-4)
## License
[MIT](https://github.com/arvind-4/streamify-dashboard/blob/main/LICENSE)