https://github.com/aunnnn/rhlineplot
Line plot like in Robinhood app in SwiftUI
https://github.com/aunnnn/rhlineplot
lineplot plot robinhood stock swift swiftui ticker
Last synced: 6 months ago
JSON representation
Line plot like in Robinhood app in SwiftUI
- Host: GitHub
- URL: https://github.com/aunnnn/rhlineplot
- Owner: aunnnn
- License: mit
- Created: 2020-04-10T09:17:19.000Z (over 5 years ago)
- Default Branch: master
- Last Pushed: 2020-07-24T22:03:11.000Z (over 5 years ago)
- Last Synced: 2025-05-07T08:49:52.736Z (8 months ago)
- Topics: lineplot, plot, robinhood, stock, swift, swiftui, ticker
- Language: Swift
- Homepage:
- Size: 16.7 MB
- Stars: 280
- Watchers: 8
- Forks: 20
- Open Issues: 3
-
Metadata Files:
- Readme: README.md
- License: LICENSE
Awesome Lists containing this project
README
# RHLinePlot
Line plot like in Robinhood app, in SwiftUI

*Looking for how to do the **moving price label effect**? [Another repo here.](https://github.com/aunnnn/MovingNumbersView)*
*P.S. Of course this is not, in anyway, affiliated with Robinhood officially. This is just an attempt to replicate its UI and I don't own any of this design.*
Demo stock API is from [Alphavantage](https://www.alphavantage.co).
## Table of Contents
- [Installation](#installation)
- [APIs](#apis)
* [Without any interaction](#without-any-interaction)
* [With interactive elements](#with-interactive-elements)
- [Configuration via Environment](#configuration-via-environment)
- [TODO](#todo)
- [Fun Solved Problems](#fun-solved-problems)
* [Drag gesture consumes all the drag](#drag-gesture-consumes-all-the-drag)
* [Indicator label must stick at the edge of plot](#indicator-label-must-stick-at-the-edge-of-plot)
* [Laser mode is unresponsive to segment highlighting](#laser-mode-is-unresponsive-to-segment-highlighting)
* [The blurry effect is clipped off at the edge of the plot frame with `drawingGroup()`](#the-blurry-effect-is-clipped-off-at-the-edge-of-the-plot-frame-with-drawinggroup)
## Features :sparkles:
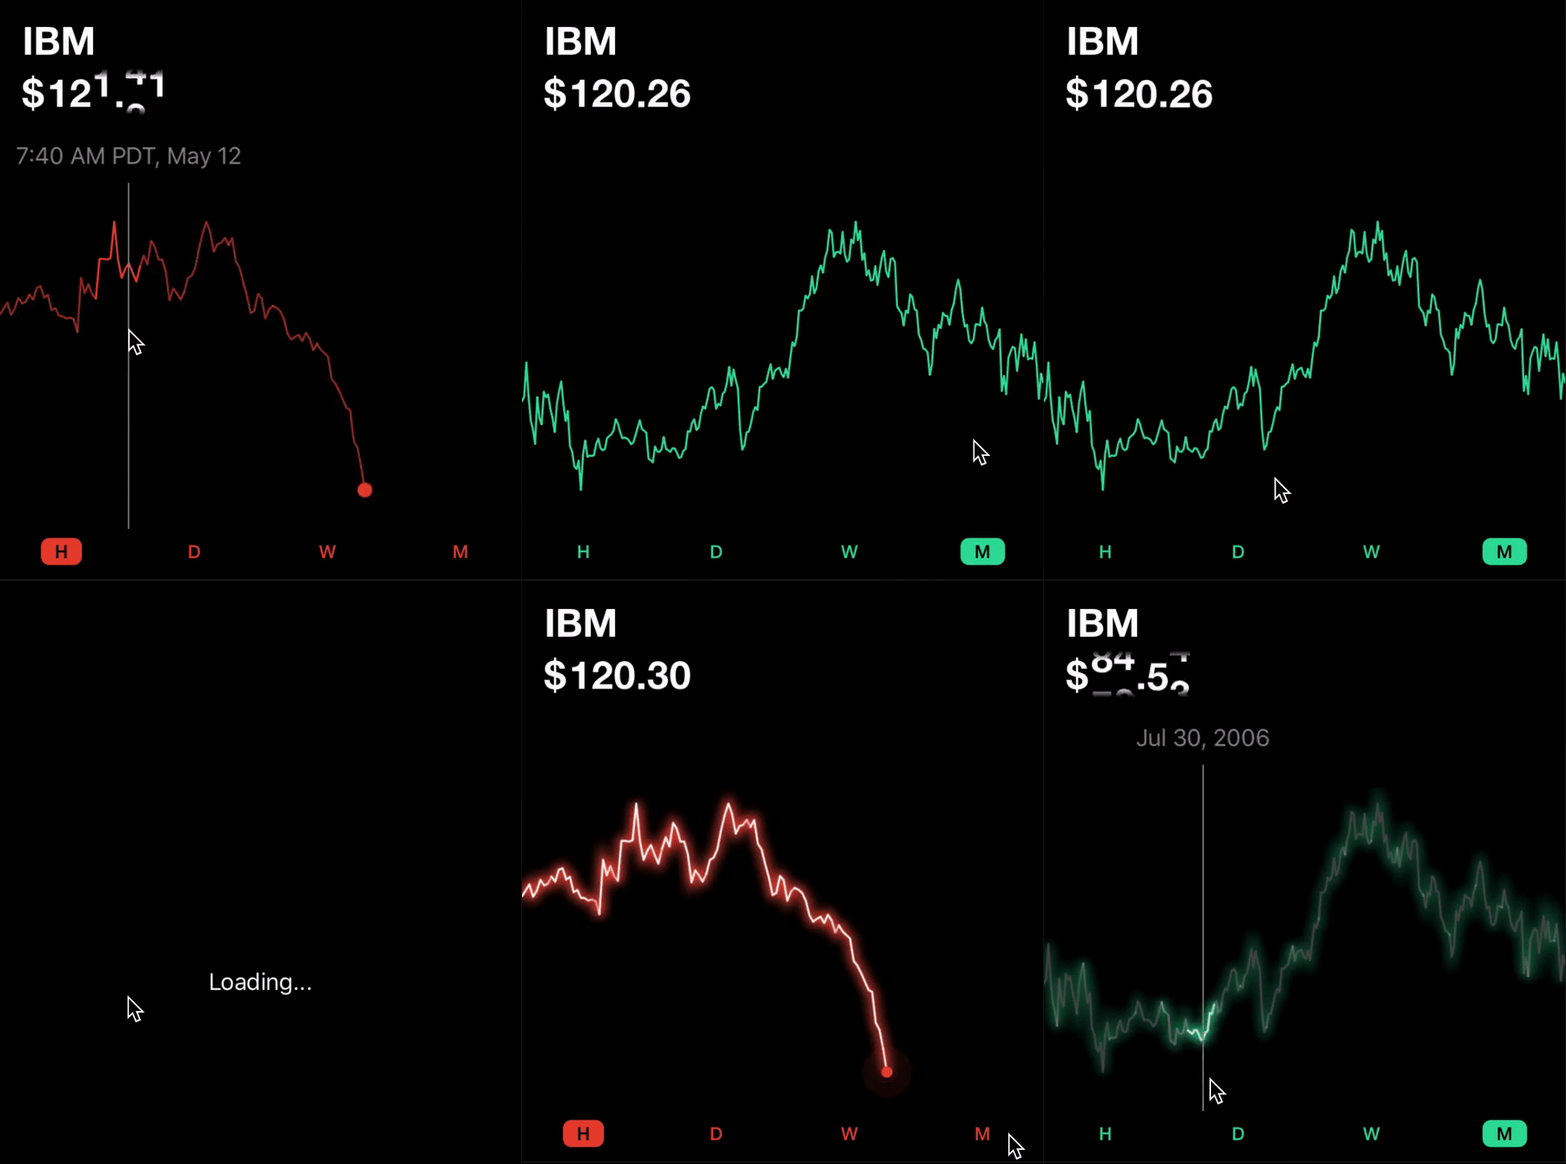
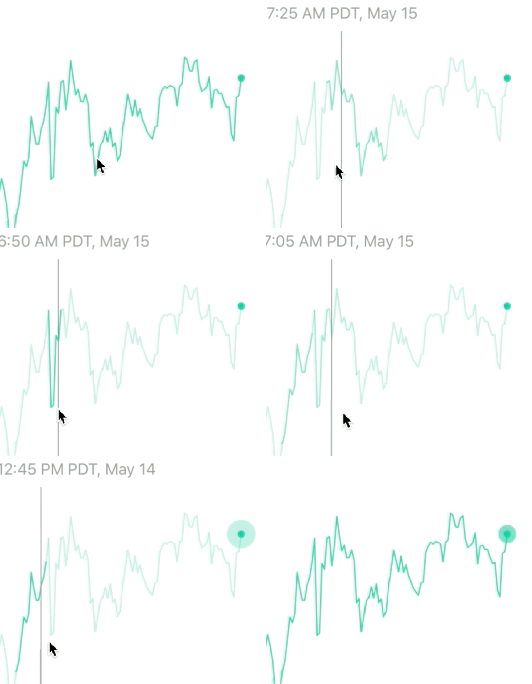
- Support drag interaction, highlight active segment
- Support glowing indicator, i.e. for real-time data
- Customize animation duration, glowing size, labels etc.
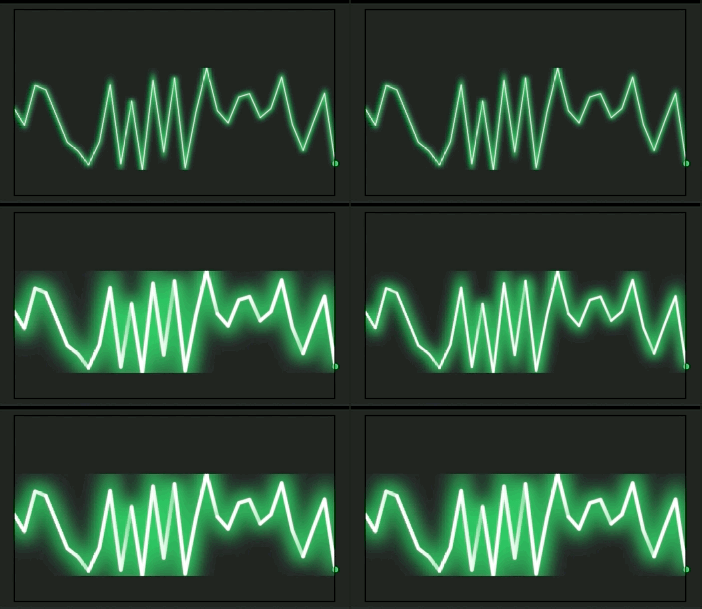
- Laser mode!
Play around with the example app to see possible customizations and the Robinhood-style view shown in the demo.
## Installation
### Cocoapods
`pod install RHLinePlot`
Or just use the source however you like. The library is in folder `RHLinePlot`.
## APIs
### Without any interaction
```swift
RHLinePlot(
values: valuesToPlot,
occupyingRelativeWidth: 0.8,
showGlowingIndicator: true,
lineSegmentStartingIndices: segments,
activeSegment: 2,
customLatestValueIndicator: {
// Return a custom glowing indicator if you want
}
)
```
Notes:
- `segments` is the beginning indices of each segment. I.e. `values = [1,2,3,4,3,2,1,2,3,4]` and `segments = [0,4,8]` means there are three segments in this line plot: 0-3, 4-7, 8-9.
- `occupyingRelativeWidth = 0.8` is to plot 80% of the plot canvas. This is useful to simulate realtime data. I.e. compute the current hour of the day relative to the 24-hour timeframe and use that ratio. By default this is 1.0.
### With interactive elements
```swift
RHInteractiveLinePlot(
values: values,
occupyingRelativeWidth: 0.8,
showGlowingIndicator: true,
lineSegmentStartingIndices: segments,
didSelectValueAtIndex: { index in
// Do sth useful with index...
},
customLatestValueIndicator: {
// Custom indicator...
},
valueStickLabel: { value in
// Label above the value stick...
})
```
## Configuration via Environment
To customize:
```swift
YourView
.environment(\.rhLinePlotConfig, RHLinePlotConfig.default.custom(f: { (c) in
c.useLaserLightLinePlotStyle = isLaserModeOn
}))
```
Full config:
```swift
public struct RHLinePlotConfig {
/// Width of the rectangle holding the glowing indicator (i.e. not `radius`, but rather `glowingIndicatorWidth = 2*radius`). Default is `8.0`
public var glowingIndicatorWidth: CGFloat = 8.0
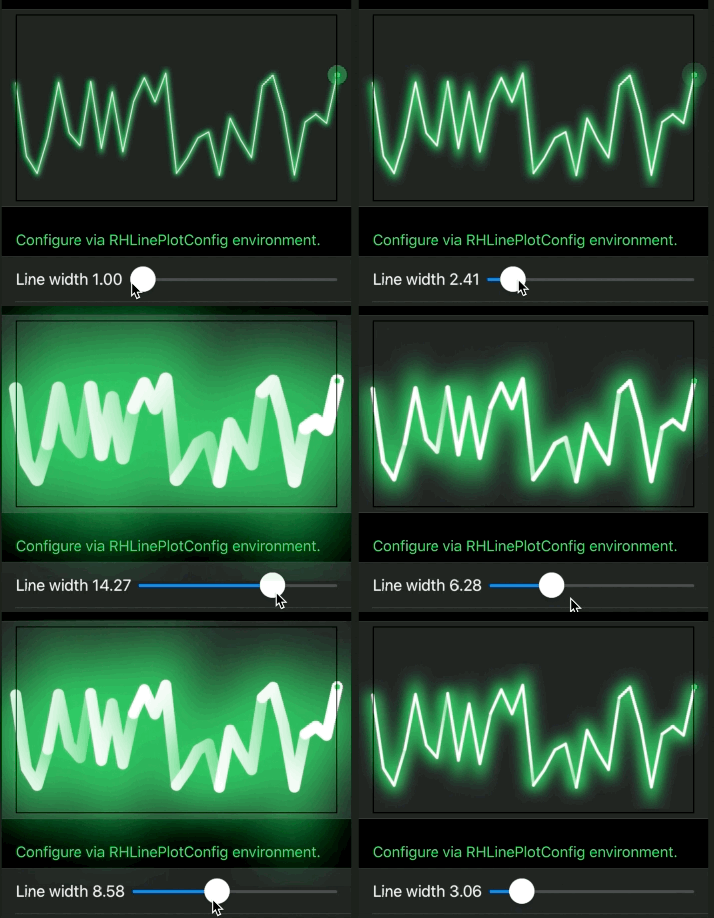
/// Line width of the line plot. Default is `1.5`
public var plotLineWidth: CGFloat = 1.5
/// If all values are equal, we will draw a straight line. Default is 0.5 which draws a line at the middle.
public var relativeYForStraightLine: CGFloat = 0.5
/// Opacity of unselected segment. Default is `0.3`.
public var opacityOfUnselectedSegment: Double = 0.3
/// Animation duration of opacity on select/unselect a segment. Default is `0.1`.
public var segmentSelectionAnimationDuration: Double = 0.1
/// Scale the fading background of glowing indicator to specified value. Default is `5` (scale to 5 times bigger before disappear)
public var glowingIndicatorBackgroundScaleEffect: CGFloat = 5
public var glowingIndicatorDelayBetweenGlow: Double = 0.5
public var glowingIndicatorGlowAnimationDuration: Double = 0.8
/// Use laser stroke mode to plot lines.
///
/// Note that your plot will be automatically shrinked so that the blurry part fits inside the canvas.
public var useLaserLightLinePlotStyle: Bool = false
/// Use drawing group for laser light mode.
///
/// This will increase responsiveness if there's a lot of segments.
/// **But, the blurry parts will be clipped off the canvas bounds.**
// public var useDrawingGroupForLaserLightLinePlotStyle: Bool = false
/// The edges to fit the line strokes within canvas. This interacts with `plotLineWidth`. Default is `[]`.
///
/// By default only the line skeletons (*paths*) exactly fits in the canvas,** without considering the `plotLineWidth`**.
/// So when you increase the line width, the edge of the extreme values could go out of the canvas.
/// You can provide a set of edges to consider to adjust to fit in canvas.
public var adjustedEdgesToFitLineStrokeInCanvas: Edge.Set = []
// MARK:- RHInteractiveLinePlot
public var valueStickWidth: CGFloat = 1.2
public var valueStickColor: Color = .gray
/// Padding from the highest point of line plot to value stick. If `0`, the top of value stick will be at the same level of the highest point in plot.
public var valueStickTopPadding: CGFloat = 28
/// Padding from the lowest point of line plot to value stick. If `0`, the end of value stick will be at the same level of the lowest point in plot.
public var valueStickBottomPadding: CGFloat = 28
public var spaceBetweenValueStickAndStickLabel: CGFloat = 8
/// Duration of long press before the value stick is activated and draggable.
///
/// The more it is, the less likely the interactive part is activated accidentally on scroll view. Default is `0.1`.
///
/// There's some lower-bound on this value that I guess coming from delaysContentTouches of
/// the ScrollView. So if this is `0`, iit won't immediately activate the long press (but quickly horizontal pan will).
public var minimumPressDurationToActivateInteraction: Double = 0.1
public static let `default` = RHLinePlotConfig()
public func custom(f: (inout RHLinePlotConfig) -> Void) -> RHLinePlotConfig {
var new = self
f(&new)
return new
}
}
```
## TODO
- Support two finger drag to compare between two values on the plot.
- ~Dragging in the interactive plot consumes all the gestures. If you put it in a `ScrollView`, you can't scroll the scroll view in the interactive plot area, you'd be interacting with the plot instead.~ - Fixed by using a clear [proxy view](https://github.com/aunnnn/RHLinePlot/blob/master/RHLinePlot/PressAndHorizontalDragGesture.swift) to handle gestures
## Fun Solved Problems
### Drag gesture consumes all the drag
> Problem: So you can't put the plot in a scroll view and scroll down on the plot. I tried adding `LongPressGesture` like in Apple's tutorial, but looks like it too consumes gesture exclusively if put under a scroll view.
Solution: This is currently fixed by putting a [proxy view](https://github.com/aunnnn/RHLinePlot/blob/master/RHLinePlot/PressAndHorizontalDragGesture.swift) that implements custom long press gesture detection.
### Indicator label must stick at the edge of plot
> Problem: To stick the indicator label (`valueStickLabel`) translation at the horizontal edge of the plot, we need to know the label width. However its content is dynamic, it could be anything a user set.
Solution: This is fixed by having two `valueStickLabel`s. First one is used for sizing and hidden away. The second one is overlaid on the first with `GeometryReader`, so we know the final size of the label, ready to calculate the translation next (where we could clamp its offset with the width).
```swift
// Indicator Label
//
// HACK: Get a dynamic size of the indicator label with `overlay` + `GeometryReader`.
// Hide the bottom one (just use it for sizing), then show the overlaid one.
valueStickLabel.opacity(0)
.overlay(
GeometryReader { labelProxy in
valueStickLabel
.transformEffect(labelTranslation(labelProxy: labelProxy))
}.opacity(stickAndLabelOpacity))
```

### Laser mode is unresponsive to segment highlighting
> Problem: The laser mode puts 3 blur effects on each segment of the line plot, so it can be unresponsive to drag around fast and animate opacity of different parts.
Solution: Just use `drawingGroup()`. This helps a lot. However, this introduces the next issue:
### The blurry effect is clipped off at the edge of the plot frame with `drawingGroup()`
> Problem: Using `drawingGroup()` seems to apply the `clipsToBounds`-like effect on the blurry part, and it doesn't look nice.

Solution: [Inset the plot canvas](https://github.com/aunnnn/RHLinePlot/blob/master/RHLinePlot/RHLinePlot%2BSegmented.swift) relative to the `plotLineWidth` config (the larger the value, the larger the blurry blob) so that `drawingGroup` has more space to draw and cache image:
```swift
let adjustedEachBorderDueToBlur: CGFloat = {
if rhLinePlotConfig.useLaserLightLinePlotStyle {
return 7.5 * rhLinePlotConfig.plotLineWidth // Magic number accounts for blurring
} else {
return 0
}
}()
let largerCanvas = canvasFrame.insetBy(dx: -adjustedEachBorderDueToBlur, dy: -adjustedEachBorderDueToBlur)
```
