https://github.com/aws-observability/terraform-aws-observability-accelerator
Open source project to help accelerate and ease observability setup on AWS environments
https://github.com/aws-observability/terraform-aws-observability-accelerator
aws eks eks-cluster grafana kubernetes opentelemetry prometheus terraform
Last synced: about 1 year ago
JSON representation
Open source project to help accelerate and ease observability setup on AWS environments
- Host: GitHub
- URL: https://github.com/aws-observability/terraform-aws-observability-accelerator
- Owner: aws-observability
- License: apache-2.0
- Created: 2022-08-16T08:20:48.000Z (almost 4 years ago)
- Default Branch: main
- Last Pushed: 2024-11-26T11:30:32.000Z (over 1 year ago)
- Last Synced: 2025-04-01T09:26:33.357Z (over 1 year ago)
- Topics: aws, eks, eks-cluster, grafana, kubernetes, opentelemetry, prometheus, terraform
- Language: HCL
- Homepage: https://aws-observability.github.io/terraform-aws-observability-accelerator/
- Size: 2.56 MB
- Stars: 299
- Watchers: 9
- Forks: 88
- Open Issues: 9
-
Metadata Files:
- Readme: README.md
- Contributing: CONTRIBUTING.md
- License: LICENSE
- Code of conduct: CODE_OF_CONDUCT.md
- Codeowners: CODEOWNERS
- Support: docs/support.md
Awesome Lists containing this project
README
# AWS Observability Accelerator for Terraform
[](https://github.com/aws-observability/terraform-aws-observability-accelerator/actions/workflows/pre-commit.yaml)
[](https://github.com/aws-observability/terraform-aws-observability-accelerator/actions/workflows/plan-examples.yml)
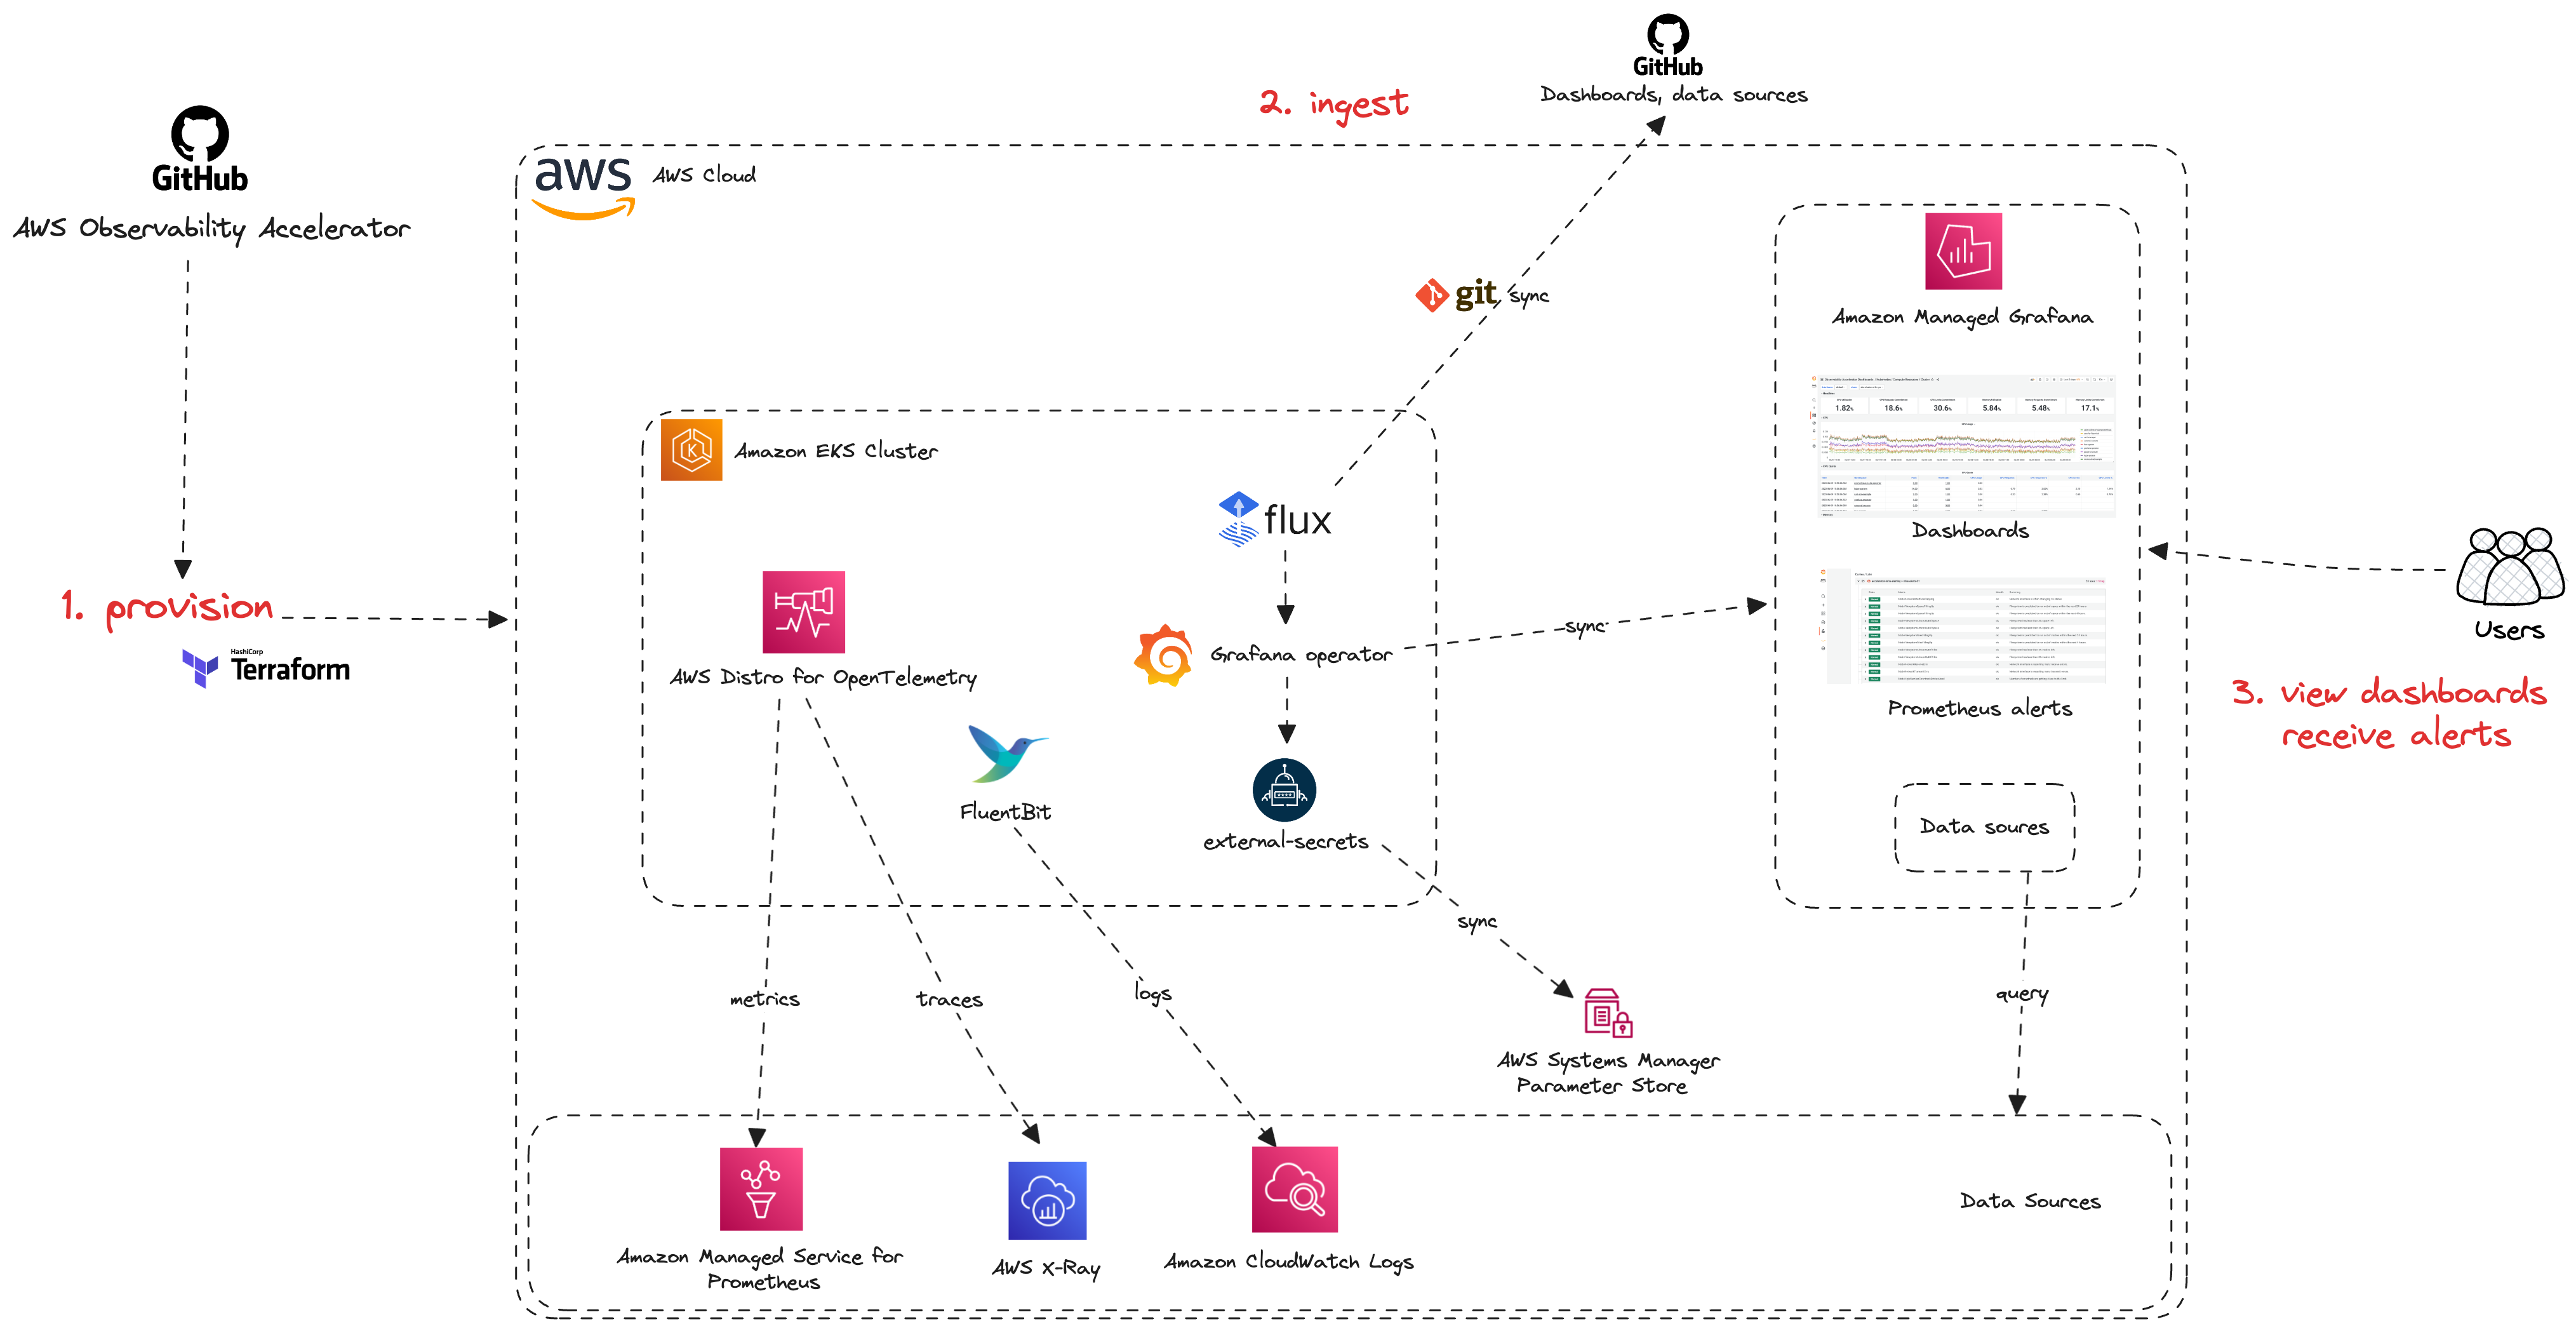
Welcome to the AWS Observability Accelerator for Terraform!
The AWS Observability Accelerator for Terraform is a set of opinionated modules
to help you set up observability for your AWS environments with
AWS-managed observability services such as Amazon Managed Service for Prometheus,
Amazon Managed Grafana, AWS Distro for OpenTelemetry (ADOT) and Amazon CloudWatch.
We provide curated metrics, logs, traces collection, alerting rules and Grafana
dashboards for your AWS infrastructure and custom applications.
## Documentation
To explore the complete project documentation, please visit our [documentation site.](https://aws-observability.github.io/terraform-aws-observability-accelerator/)
## ⚠️ Dropping base module
Starting in v2.12.0, we have removed the [base module](https://github.com/aws-observability/terraform-aws-observability-accelerator/blob/v2.10.3/docs/concepts.md#base-module)
which previously served as a glue between modules. However, the modules were quite
independent and the base module provided limited functionality.
We have moved the creation of Managed Prometheus Workspaces into the
[eks-monitoring module](https://github.com/aws-observability/terraform-aws-observability-accelerator/tree/main/modules/eks-monitoring).
See our [examples](https://github.com/aws-observability/terraform-aws-observability-accelerator/tree/main/examples)
to understand the changes.
## Modules
This accelerator provides the following observability modules:
- [EKS Monitoring with AWS-Managed Open Source](https://aws-observability.github.io/terraform-aws-observability-accelerator/eks/) - Get Prometheus metrics, CloudWatch logs collection, and X-Ray traces (with OTLP support) for your EKS cluster. Visualize key metrics and logs with provided Grafana dashboards and get pre-built alerting rules.
- [EKS Monitoring with Enhanced CloudWatch Container Insights](https://aws-observability.github.io/terraform-aws-observability-accelerator/container-insights/eks/) - Get deep visibility into EKS using Amazon CloudWatch for metrics collection, aggregation, and insights summaries. Includes support for [CloudWatch Application Signals (preview)](https://docs.aws.amazon.com/AmazonCloudWatch/latest/monitoring/CloudWatch-Application-Monitoring-Sections.html)
- [ECS Monitoring on EC2 with AWS-Managed Open Source](https://aws-observability.github.io/terraform-aws-observability-accelerator/ecs/ecs-monitoring-on-ec2/) - Collect metrics, traces, and logs for ECS on EC2 and send them to a Managed Prometheus workspace , X-Ray, and CloudWatch Logs. Includes pre-built Grafana dashboards for key metrics and logs.
- [Managed Prometheus Monitoring](https://aws-observability.github.io/terraform-aws-observability-accelerator/workloads/managed-prometheus/) - This module sets up automated observability for Amazon Managed Service for Prometheus workspaces, including a Grafana dashboard, CloudWatch monitoring, and service quota alarms.
## Motivation
To gain deep visibility into your workloads and environments, AWS proposes a
set of secure, scalable, highly available, production-grade managed open
source services such as Amazon Managed Service for Prometheus, Amazon Managed
Grafana and Amazon OpenSearch.
AWS customers have asked for best-practices and guidance to collect metrics, logs
and traces from their containerized applications and microservices with ease of
deployment. Customers can use the AWS Observability Accelerator to configure their
metrics and traces collection to have opinionated dashboards and alerts
available in only minutes.
## Support & Feedback
AWS Observability Accelerator for Terraform is maintained by AWS Solution
Architects. It is not part of an AWS service and support is provided best-effort
by the AWS Observability Accelerator community.
To post feedback, submit feature ideas, or report bugs, please use the
[Issues](https://github.com/aws-observability/terraform-aws-observability-accelerator/issues)
section of this GitHub repo.
If you are interested in contributing, see the
[Contribution guide](https://github.com/aws-observability/terraform-aws-observability-accelerator/blob/main/CONTRIBUTING.md).
## Contributing
See [CONTRIBUTING](CONTRIBUTING.md#security-issue-notifications) for more information.
## License
Apache-2.0 Licensed. See [LICENSE](https://github.com/aws-observability/terraform-aws-observability-accelerator/blob/main/LICENSE).