https://github.com/ayoisaiah/d3-scatter-plot
Project #7 for freeCodeCamp's Data Visualization Certificate
https://github.com/ayoisaiah/d3-scatter-plot
d3 freecodecamp javascript scatter-plot visualize-data
Last synced: 3 months ago
JSON representation
Project #7 for freeCodeCamp's Data Visualization Certificate
- Host: GitHub
- URL: https://github.com/ayoisaiah/d3-scatter-plot
- Owner: ayoisaiah
- License: mit
- Created: 2017-08-09T10:41:52.000Z (almost 9 years ago)
- Default Branch: master
- Last Pushed: 2017-08-10T10:51:24.000Z (almost 9 years ago)
- Last Synced: 2026-02-18T16:04:26.249Z (5 months ago)
- Topics: d3, freecodecamp, javascript, scatter-plot, visualize-data
- Language: JavaScript
- Homepage: https://codepen.io/ayoisaiah/full/jLwbZb/
- Size: 146 KB
- Stars: 0
- Watchers: 1
- Forks: 2
- Open Issues: 0
-
Metadata Files:
- Readme: README.md
- License: LICENSE
Awesome Lists containing this project
README
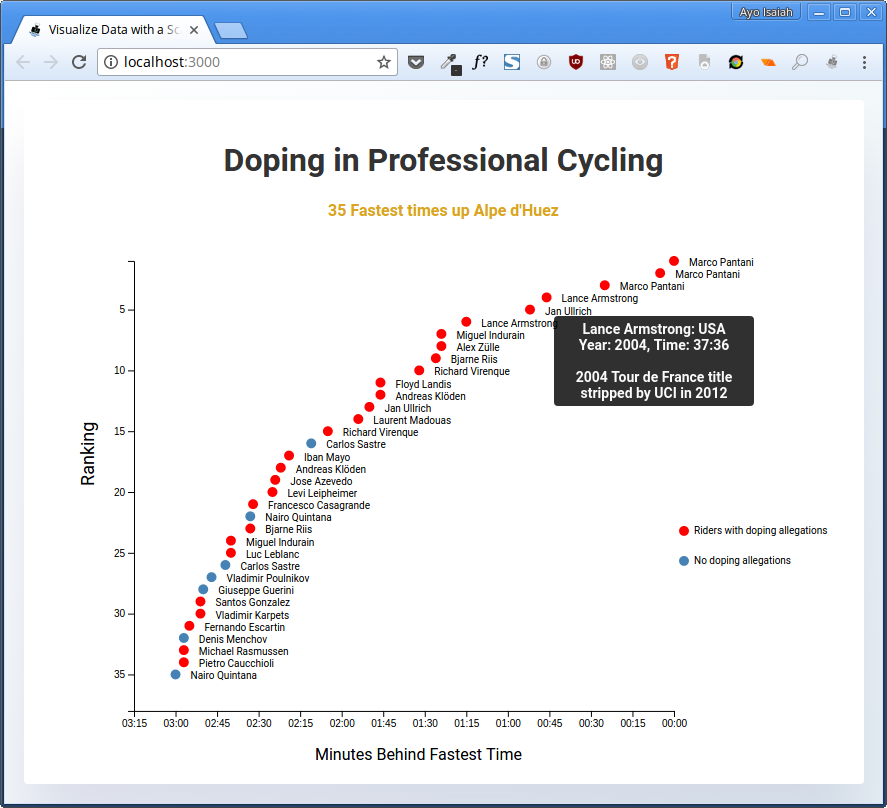
# Visualize Data with a Scatterplot Graph
This is the [seventh project](https://www.freecodecamp.org/challenges/visualize-data-with-a-scatterplot-graph) for freeCodeCamp's Data Visualization certificate.
Completed On: 10 August 2017
## Objective
Build an app that is functionally similar to this: https://codepen.io/FreeCodeCamp/full/ONxvaa/.
## User Stories
Fulfill the below user stories. Use whichever libraries or APIs you need. Give it your own personal style.
- I can see performance time visualized in a scatterplot graph.
- I can mouse over a plot to see a tooltip with additional details.
**Hint**: Here's a dataset you can use to build this: https://raw.githubusercontent.com/FreeCodeCamp/ProjectReferenceData/master/cyclist-data.json
## My Work
https://codepen.io/ayoisaiah/full/jLwbZb/