Ecosyste.ms: Awesome
An open API service indexing awesome lists of open source software.
https://github.com/ayooshkathuria/breast-tumour-maligancy-classification
Breast tumor malignancy classification using machine learning
https://github.com/ayooshkathuria/breast-tumour-maligancy-classification
machine-learning python pytorch
Last synced: about 2 months ago
JSON representation
Breast tumor malignancy classification using machine learning
- Host: GitHub
- URL: https://github.com/ayooshkathuria/breast-tumour-maligancy-classification
- Owner: ayooshkathuria
- License: mit
- Created: 2018-02-24T23:28:27.000Z (almost 7 years ago)
- Default Branch: master
- Last Pushed: 2018-02-24T23:51:44.000Z (almost 7 years ago)
- Last Synced: 2024-11-26T07:19:05.502Z (about 2 months ago)
- Topics: machine-learning, python, pytorch
- Language: Python
- Homepage:
- Size: 165 KB
- Stars: 14
- Watchers: 1
- Forks: 8
- Open Issues: 1
-
Metadata Files:
- Readme: README.md
- License: LICENSE
Awesome Lists containing this project
README
# Breast-Cancer-Malignancy-Classification-and-Inference-using-Neural-Networks
Repository containing the code for a neural network to classify breast tumours as malignant or benign, and related code to establish inferential results
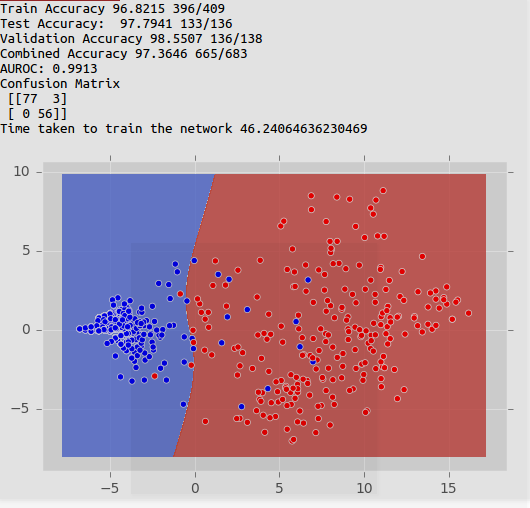
I've used a neural network to classify the breast tumour cases from UCLA Breast Cancer Dataset. The Neural network has achieved
a best accuracy of 97.94% corectly classifying 133 out of 136 cases in the test data.
## Requirements
1. PyTorch
2. Numpy
3. Matplotlib
4. Pickle
5. Pandas
6. scikit-learn
7. Tabulate
* I'll incorporate a requiremnts.txt later.
## Screenshots
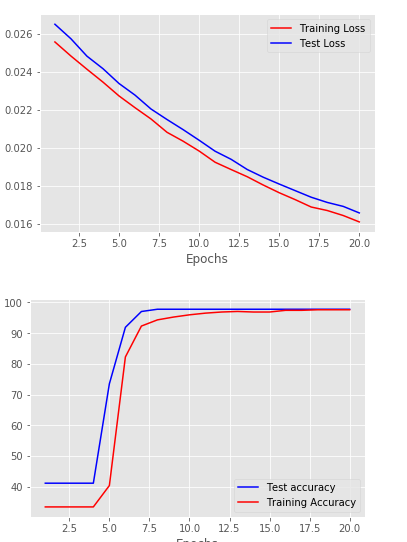
Network being trained on a 2-dimensional data containing first two principle axes

Sample results from the network trained above

## Data
* The data consists of 9 input variables and 1 target variable. All the input variables have discretized values from 1 to 10.
Normalisation was averted during earlier phases of the project, as the process is tailored for continous data. Since, all the
variables have the same scale (1-10), standardisation is not required.
* During the later phases of the project, the idea of apply pre-processing techniques tailored for continous data has been
considered. It's argued that the data is neither nominal (as different values exhibit an order), and neither ordinal (difference
between the levels of each category are measurable as well as interpretable). There, one-hot encoding is avoided.
* Application of PCA on the dataset yields the best accuracy. (Discussed later in the section dimension reduction)
* The data has been sampled as follows, 60% Training, 20% each for testing and validation set.
## Basic Architecture.
* The Neural Network architecture that has yielded the best results is a fully connected Neural Network containing an input
layers containing a variable number of features (depending upon feature importances, and lower dimensional representations),
a hidden layer containing 30 neurons having a Tanh activation function, and an output layer of two neurons, having a softmax
activation function.
* While lowering the number of hidden units causes the function to miss out on peak accuracy during more of the trial runs,
increasing the number oof hidden units merely increases the complexity of the model with no increases in the performance.
* Increasing the number of the layers causes the neural network to be heavily biased, and makes it classify all the examples
as a single class ( Explaination of this to be seeked in future)
## Optimisation and Hyperparameters
* I have used an adam optimiser, with a learning rate 0.001, a cross entropy loss function and a weight decay of 0.01. Using
a higher learning rate, causes jittery loss-vs-epoch curves.
* Adam optimizer beats Mini-Batch SGD in terms of time taken for convergence
* Early stopping using Validation accuracy has been used to stop the process if there hasn't been an improvement in 8 epochs.
* A mini-batch size of 30 has been chosen. Smaller mini-batch sizes can help inject a higher level of entropy in optimum search
whereas as lower it too much can slow down learning
## Evaluation
* Test and train accuracies, Test and train losses have been reported
* All the above metrics are visualised using graphs on a per-epoch basis. This helps us recognise overfitting, which hasn't
appeared in the project.
* Confusion matrices have been reported for test dataset
* AUROC has been reported for train dataset.
* The reported train accuracy is a average of ten runs of the network, with the best accuracy also reported.
* Testing is also done with 4-fold cross validation scheme. The prediction is the average scores of classifiers learned during different folds.
## Variable Importances
Variable importances are an important part of inference and have been measured by 4 ways.
* *Leave-one-out-evaluation *. Accuracy was measured for NNs with all the features but one feature dropped out. The importance
of the feature was inversely propotional to the new performance.
* *Using-only-one Evaluation* Accuracy was measured for model using only one feature at a time. The importance of the
feature was directly propotional to the new performance
* *Garson's Algorithm with sign*. A standard way to measure NN variable importance.
All the results were compared as well as contrasted with feature importances produced using a Grandient Boosted Machine,
using an ensemble of tree classifier. An overlap between the least important three features was found. Removing these
features improved the accuracy of the model.
## Dimensionality Reduction
* PCA was used on the dataset as it is. About 70% of the variance was explained by the first principal component. Some
consideration went into justifying whether the use of PCA was apt for the data as it was not categorical. However, since
the data is not merely ordinal and nominal as mentioned above, one can thing the data as a bucketised interval data. One
can even assume that the training set has nothing but integer realisations of a continous random variable, as one can very
well interpret geometrical distance between two datapoints.
* A neural network with only the principal component is the one that yields the best results. This suggests most of the signal
is contained along this axis, where the variation explained by other components contain noise, as their inclusion decreseas
the accuracy. This is also evident by the fact, that dropping one feature doesn't really affect te performance as the NN
would have been able to construct the representation of variance rich axes using other features.
## Things to be done
* More dimension reduction methods are autoencoders, MCA, PCA with LLDA, ICA.
* The NN often produces different results during different trials out of which not all correspond to the best result. Ofcourse
I could basically record the model parameters of the model that produces the best results, but it would be desirable if the
network produces the best results most of the times. This includes the problem of escaping local minima, which may be
linked with a better representation of data as input
* Pruning of network weights based on their statistical significance.
* More analysis of the results including reporting recall, precision, and sensitivity analysis
* Optimising the Neural Network for performance across test datasets of various sizes.