https://github.com/bbc-data-unit/bus-funding
Bus funding: Where would it make the most difference?
https://github.com/bbc-data-unit/bus-funding
buses transport
Last synced: 6 months ago
JSON representation
Bus funding: Where would it make the most difference?
- Host: GitHub
- URL: https://github.com/bbc-data-unit/bus-funding
- Owner: BBC-Data-Unit
- Created: 2020-02-14T10:09:52.000Z (over 6 years ago)
- Default Branch: master
- Last Pushed: 2020-02-14T16:41:15.000Z (over 6 years ago)
- Last Synced: 2025-05-17T13:08:08.010Z (about 1 year ago)
- Topics: buses, transport
- Homepage: https://www.bbc.co.uk/news/uk-england-51460437
- Size: 399 KB
- Stars: 1
- Watchers: 4
- Forks: 0
- Open Issues: 0
-
Metadata Files:
- Readme: README.md
Awesome Lists containing this project
README
# Bus funding: Where would it make the most difference?
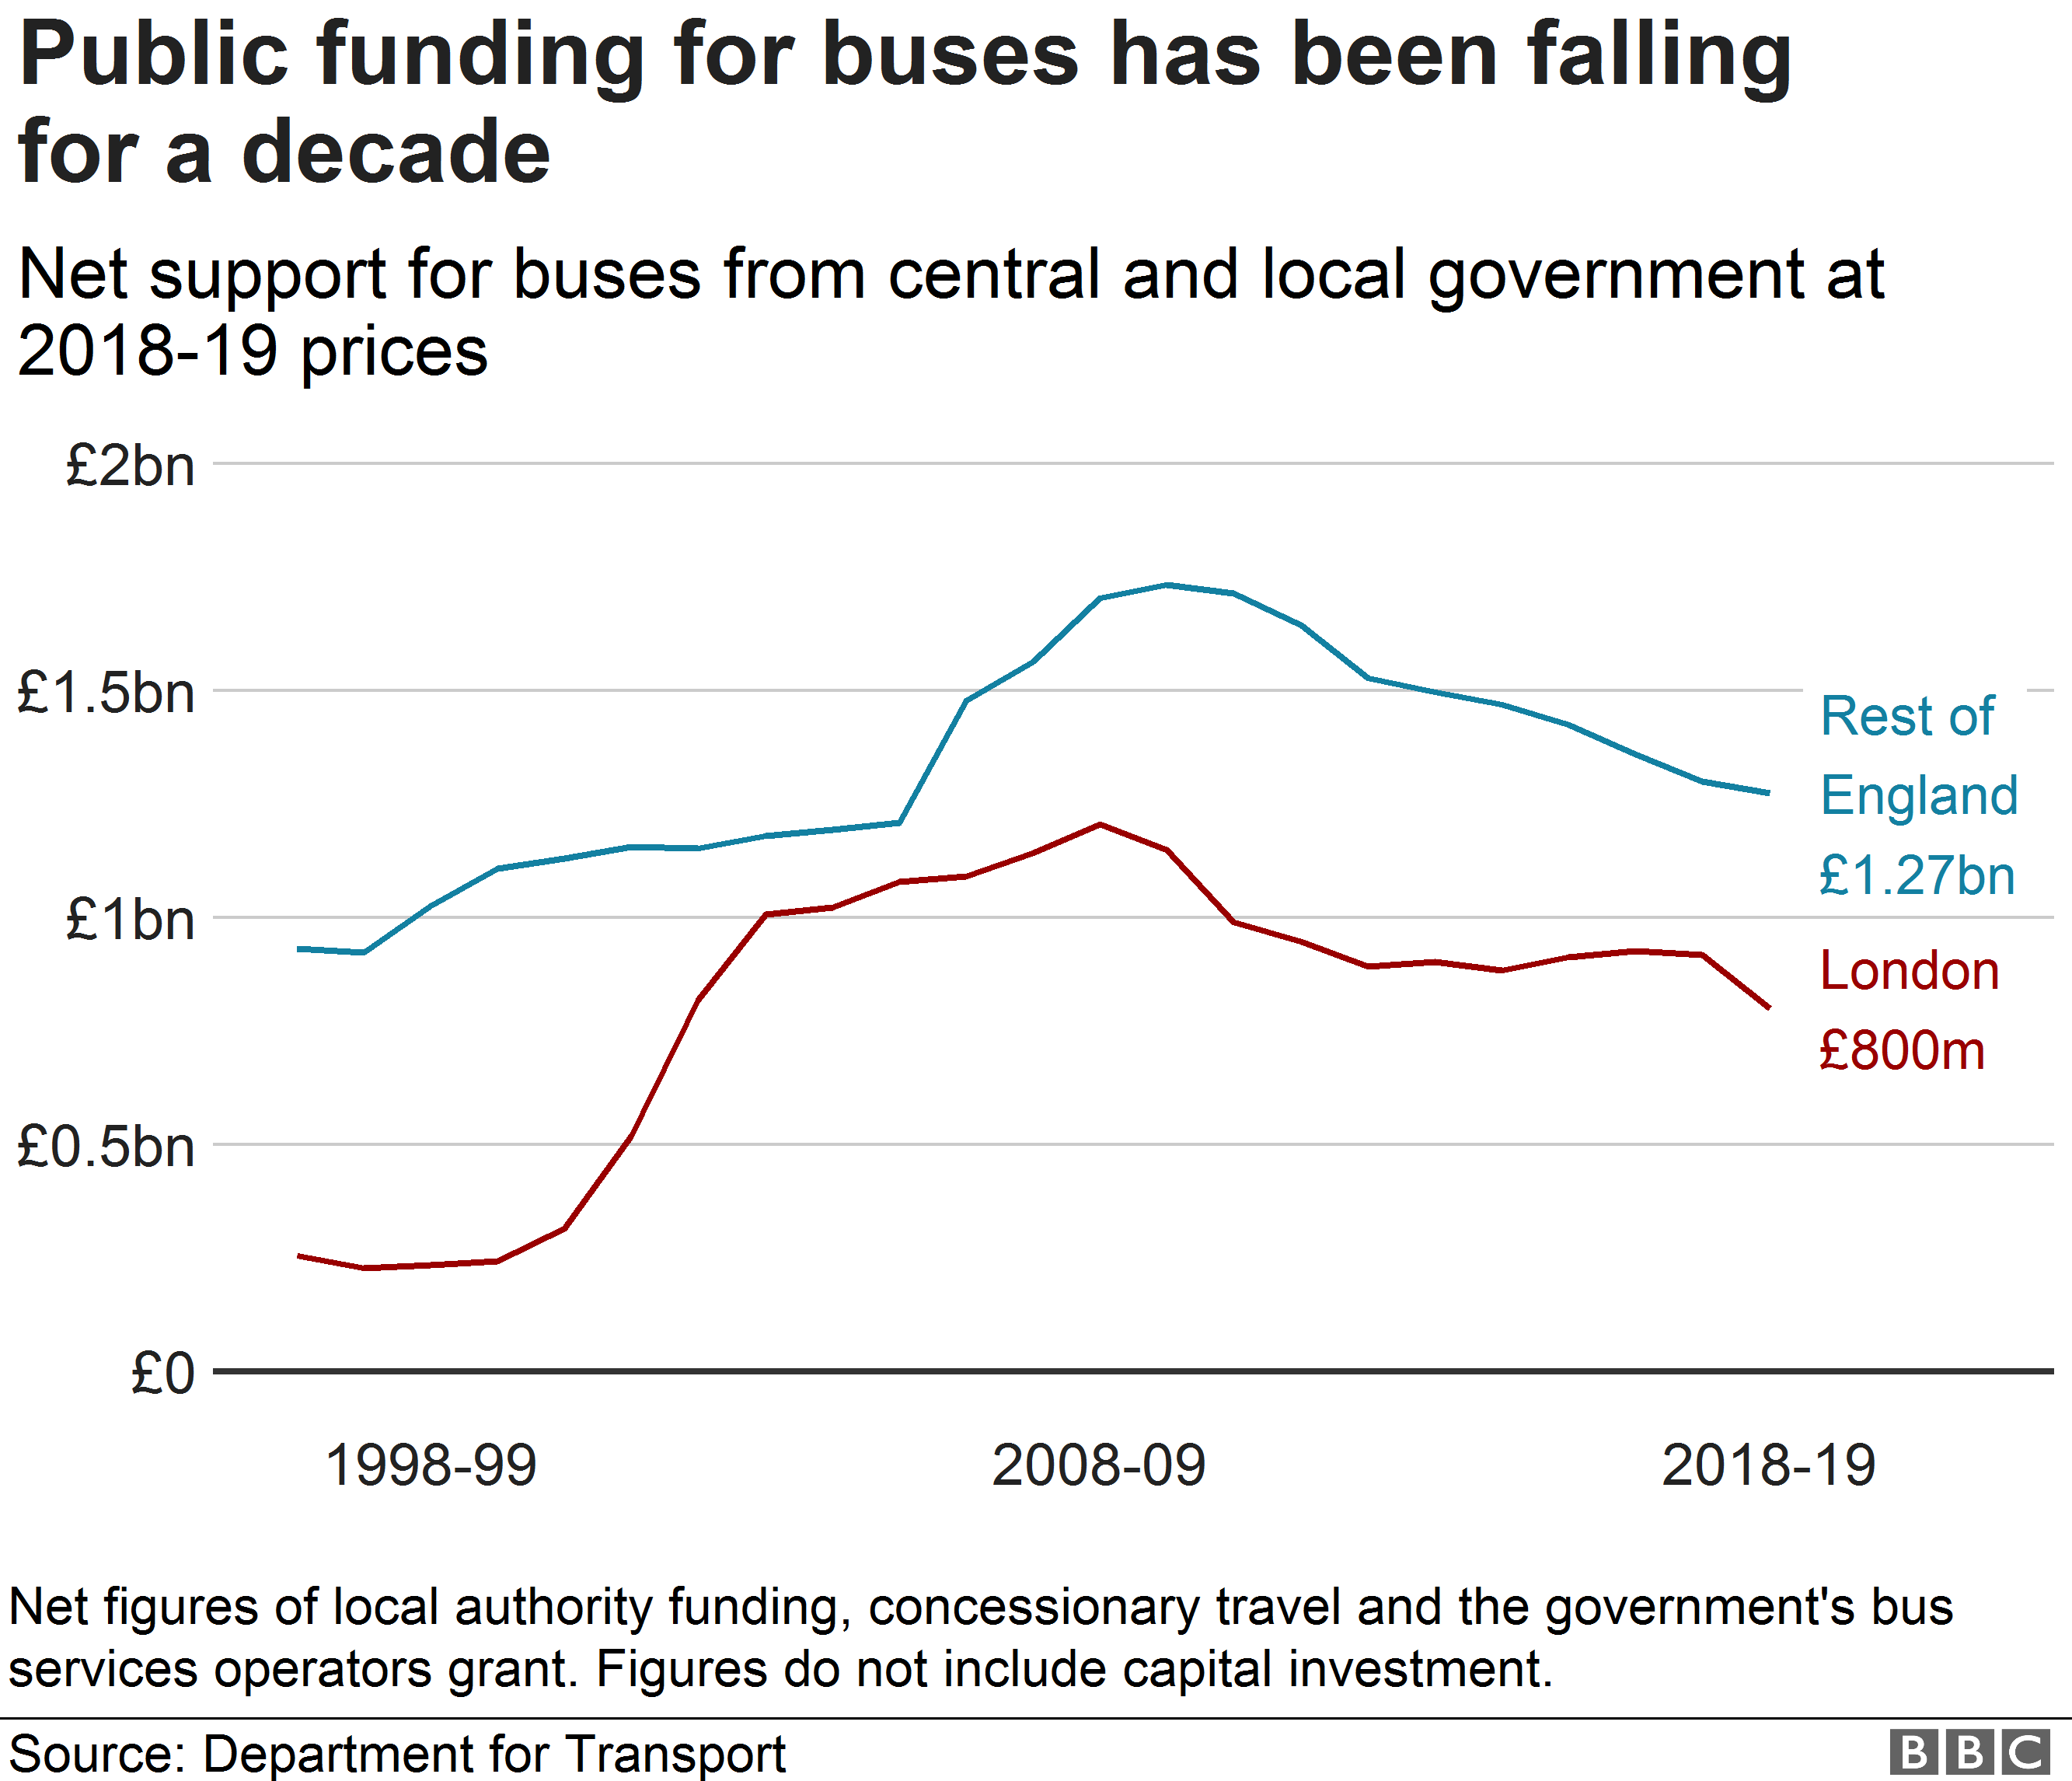
The government has promised £5bn for bus services and cycling over five years.
We [looked at how spending on support for local bus services has changed](https://www.bbc.co.uk/news/uk-england-51460437), where passenger numbers have risen and fallen the most and where the bus is used most per head of population around England.
Sources of data are all from the Department for Transport’s bus statistics.
## Get the data
* Department for Transport: [Bus statistics](https://www.gov.uk/government/collections/bus-statistics)
* CSV: [Journeys by area and year](https://github.com/BBC-Data-Unit/bus-funding/blob/master/bus.csv)
* CSV: [Bus funding per head by local authority](https://github.com/BBC-Data-Unit/bus-funding/blob/master/busperhead.csv)
* CSV: [Bus journeys by local authority 2010 and 2019, including change](https://github.com/BBC-Data-Unit/bus-funding/blob/master/busrisefall.csv)
* CSV: [Bus funding by area and year](https://github.com/BBC-Data-Unit/bus-funding/blob/master/funding.csv)
## Quotes and interviews
* Spokesperson, Campaign for Better Transport
* Crispin Truman, countryside charity CPRE
* Councillor David Williams, County Councils Network
## Visualisation
* Line chart: Public funding for buses, 1998/99-2018/19
* Bar chart: Local bus journeys per head of population, 2018-19
* Bar chart: Percentage change in journeys made between 2009/10 and 2018/19
* Infographic: England's buses in numbers