https://github.com/bbc-data-unit/council-cuts-charts
How cuts changed council spending, in seven charts
https://github.com/bbc-data-unit/council-cuts-charts
councils cuts listicle r tomcalver
Last synced: 9 months ago
JSON representation
How cuts changed council spending, in seven charts
- Host: GitHub
- URL: https://github.com/bbc-data-unit/council-cuts-charts
- Owner: BBC-Data-Unit
- Created: 2018-12-06T12:05:32.000Z (over 7 years ago)
- Default Branch: master
- Last Pushed: 2019-01-02T09:59:10.000Z (over 7 years ago)
- Last Synced: 2024-12-27T08:42:10.673Z (over 1 year ago)
- Topics: councils, cuts, listicle, r, tomcalver
- Language: HTML
- Homepage: https://www.bbc.co.uk/news/uk-england-46443700
- Size: 4.22 MB
- Stars: 0
- Watchers: 5
- Forks: 0
- Open Issues: 0
-
Metadata Files:
- Readme: README.md
- Changelog: change.plot.png
Awesome Lists containing this project
README
# How cuts changed council spending, in seven charts
In December 2018 we published [an article showing 7 ways in which cuts had changed council spending](https://www.bbc.co.uk/news/uk-england-46443700). **Tom Calver** provided additional analysis and visualisation.
The cleaning, combination and analysis was largely done in R. You can find a number of notebooks and R scripts in this repo, with descriptions below.
## Get the data
* Most of the data was taken from the [Local authority revenue expenditure and financing collection](https://www.gov.uk/government/collections/local-authority-revenue-expenditure-and-financing), going back to 2010-11
* Copies of the spreadsheets can be found in this repo, each beginning with 'Revenue_Outturn_Summary__RS__data'. The 2017/18 data is named [RS_2017-18_data_by_LA.xlsx](https://github.com/BBC-Data-Unit/council-cuts-charts/blob/master/RS_2017-18_data_by_LA.xlsx)
## Quotes and interviews
* Kathy Evans, chief executive, Children England
* Spokesperson, County Councils Network
* Spokesperson, The Ministry of Housing, Communities and Local Government (MHCLG)
* Spokesman, Local Government Association
## Visualisation
* Stacked bar chart: spend per person on each service across England 2017/18
* Multiple filled line charts: spend per person on each service, 2010/11 - 2017/18
* Multiple bar chart: Spending by councils in 2010/11 vs 2017/18, as pence in pound, by service
* Line chart: average Band D council tax in England, 2010/11 - 2018/19
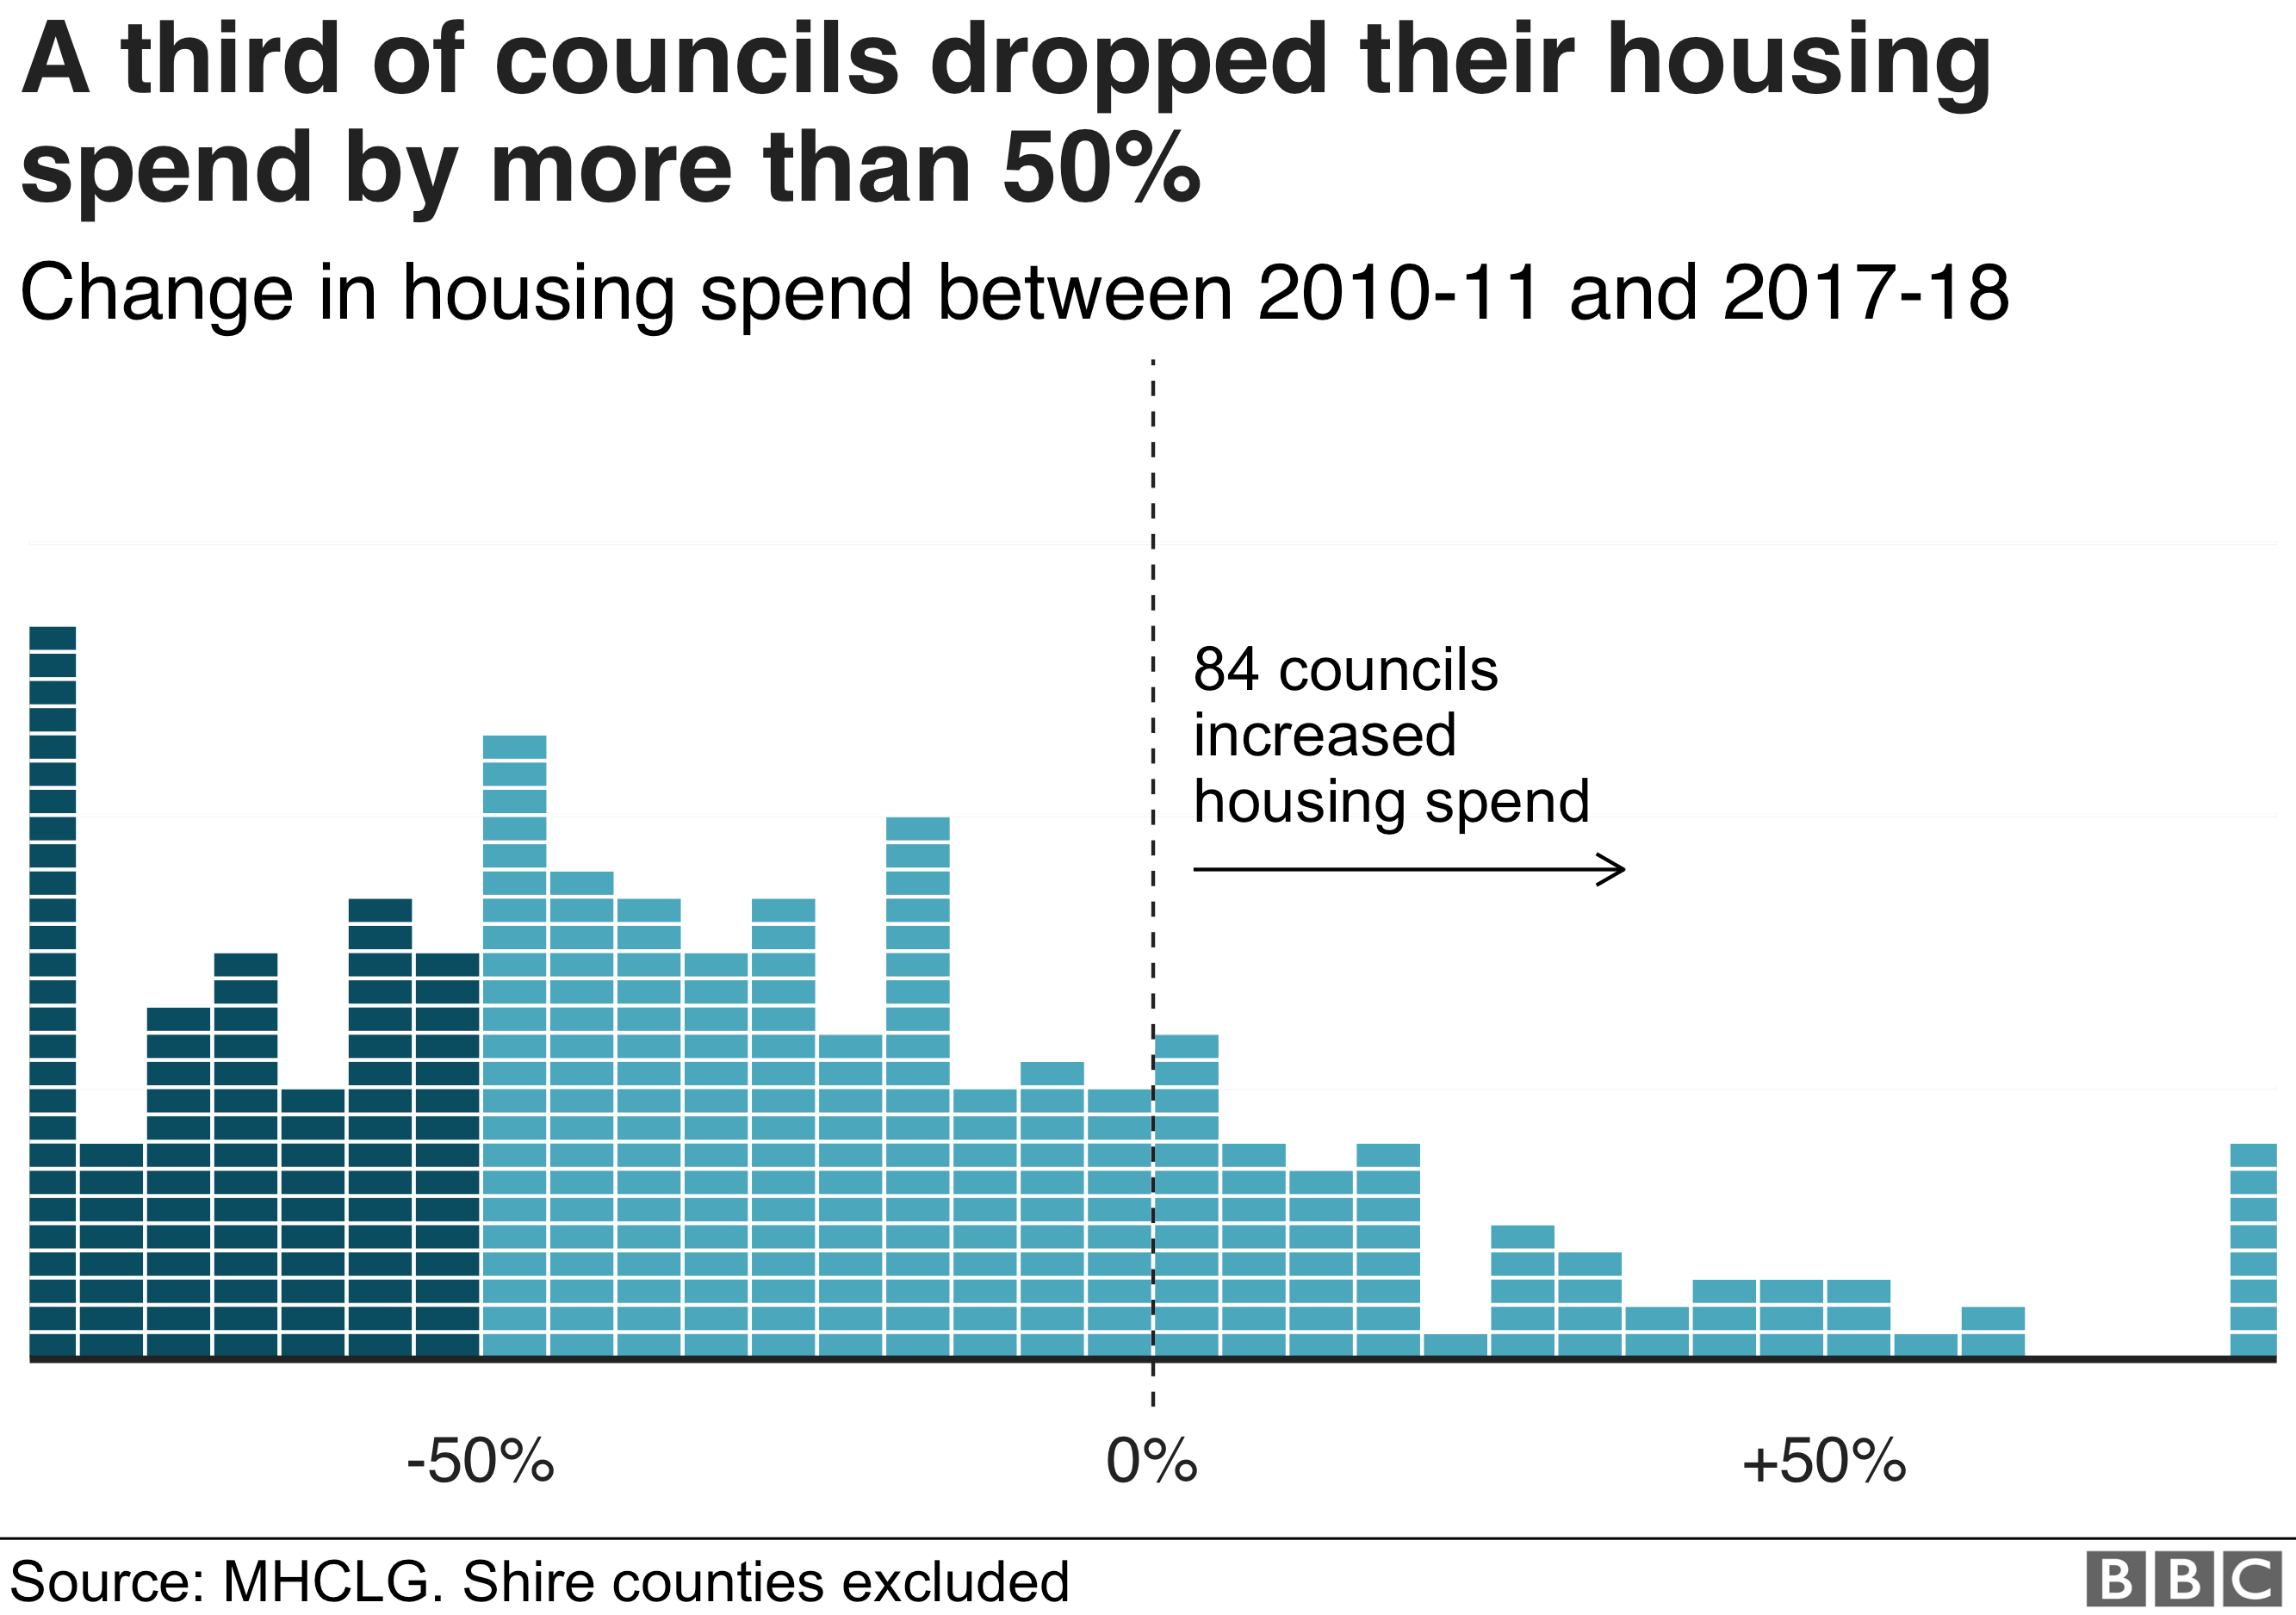
* Histogram: distribution of change in housing spend, 2010/11 - 2017/18
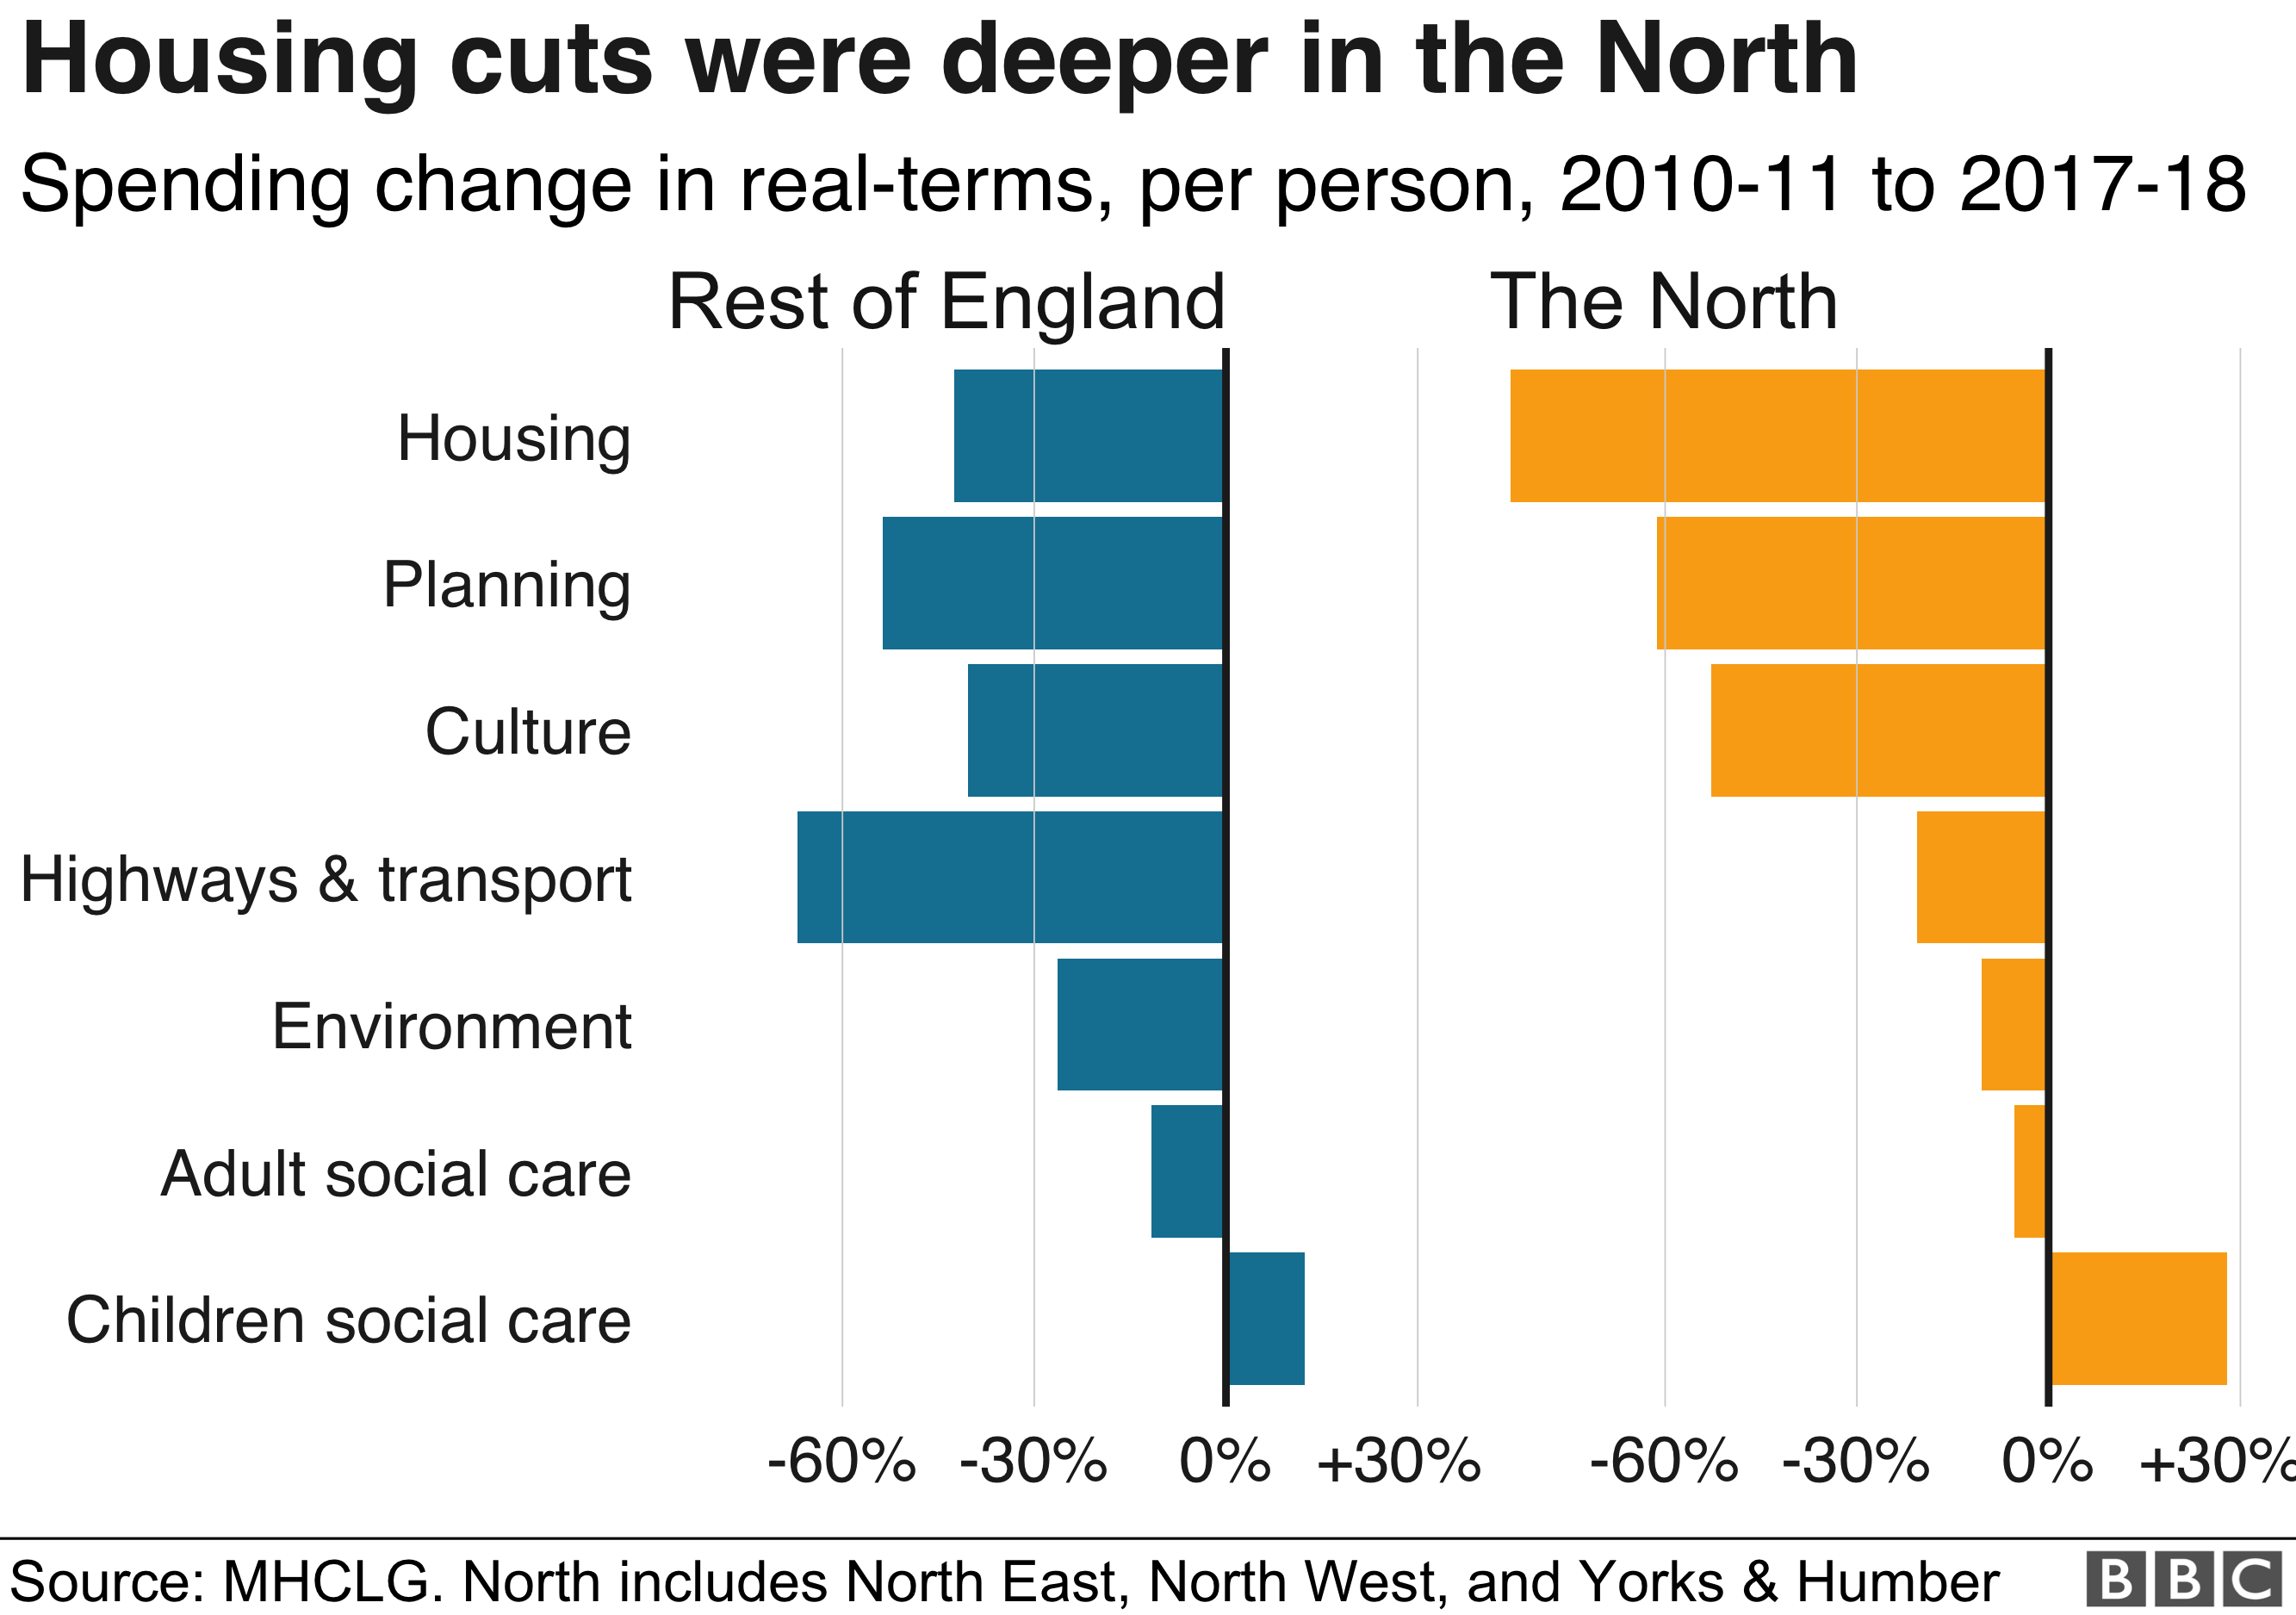
* Multiple bar chart: Spending change in real terms, per person 2010/11 - 2017/18: North vs Rest of England
* Histogram: distribution of usable reserves as a percentage of 2017/18 spending
## Analysis, scripts and notebooks
* The notebook [1downloadcleanaccounts.Rmd](https://github.com/BBC-Data-Unit/council-cuts-charts/blob/master/1downloadcleanaccounts.Rmd) details the process of downloading, cleaning, and analysing council accounts.
* The notebook [1bcombineaccounts.Rmd](https://github.com/BBC-Data-Unit/council-cuts-charts/blob/master/1bcombineaccounts.Rmd) details the process of combining the council accounts.
* The notebook [1ccombineaccounts_cbind.Rmd](https://github.com/BBC-Data-Unit/council-cuts-charts/blob/master/1ccombineaccounts_cbind.Rmd) details the process of combining council accounts using `cbind`. This process was not used in the end, however, as using the uncombined accounts with `sqldf` (below) was a much simpler and more flexible approach
* The notebook [1ccombineaccounts_sqldf.Rmd](https://github.com/BBC-Data-Unit/council-cuts-charts/blob/master/1ccombineaccounts_sqldf.Rmd) details the process of querying multiple council accounts to make comparisons.
* The notebook [2analyseaccountsDANamended.Rmd](https://github.com/BBC-Data-Unit/council-cuts-charts/blob/master/2analyseaccountsDANamended.Rmd) outlines the process of analysing the accounts further
* The R function script [stripbackro.horiz.R](https://github.com/BBC-Data-Unit/council-cuts-charts/blob/master/stripbackro.horiz.R) takes an Excel filename and a year, then returns a subset for main categories of spending with the year added as a prefix for the columns
* The R script [givemesqlquery.fromto.R](https://github.com/BBC-Data-Unit/council-cuts-charts/blob/master/givemesqlquery.fromto.R) will, given a column name, and the names of 2 data frames, generate a SQL query that will generate
#a table showing change from one data frame to another
## Related repos
* You can [find all stories tagged 'cuts' that the data units have been involved in here](https://github.com/search?q=topic%3Acuts+org%3ABBC-Data-Unit&type=Repositories)