Ecosyste.ms: Awesome
An open API service indexing awesome lists of open source software.
https://github.com/bbc-data-unit/deprivation
England's most deprived areas named as Jaywick and Blackpool
https://github.com/bbc-data-unit/deprivation
blackpool deprivation jaywick mhclg poverty
Last synced: 7 days ago
JSON representation
England's most deprived areas named as Jaywick and Blackpool
- Host: GitHub
- URL: https://github.com/bbc-data-unit/deprivation
- Owner: BBC-Data-Unit
- Created: 2019-10-02T08:51:02.000Z (over 5 years ago)
- Default Branch: master
- Last Pushed: 2019-10-16T13:02:01.000Z (about 5 years ago)
- Last Synced: 2024-11-07T05:30:14.473Z (about 2 months ago)
- Topics: blackpool, deprivation, jaywick, mhclg, poverty
- Homepage: https://www.bbc.co.uk/news/uk-england-49812519
- Size: 23.4 KB
- Stars: 0
- Watchers: 5
- Forks: 0
- Open Issues: 0
-
Metadata Files:
- Readme: README.md
Awesome Lists containing this project
README
# England's most deprived areas named as Jaywick and Blackpool

In September 2019 we [reported](https://www.bbc.co.uk/news/uk-england-49812519) on the first release in four years of the Indices of Deprivation.
The data, released by the Ministry of Housing, Communities and Local Government (MHCLG), looks at levels of income, employment, education, health and crime as well as housing services and living environment in 32,844 neighbourhoods.
Knowing that the data was going to be released, we were able to prepare an R script that would combine it with previous releases and perform the analyses that we wanted on the day, as well as conduct interviews in advance of the day.
## Get the data
* [English indices of deprivation 2019](https://www.gov.uk/government/statistics/english-indices-of-deprivation-2019)
## Interviews and quotes
* Dan Casey, Jaywick councillor (Independent)
* Andy Preston, mayor of Middlesbrough
* Spokesman, Government
## Visualisation

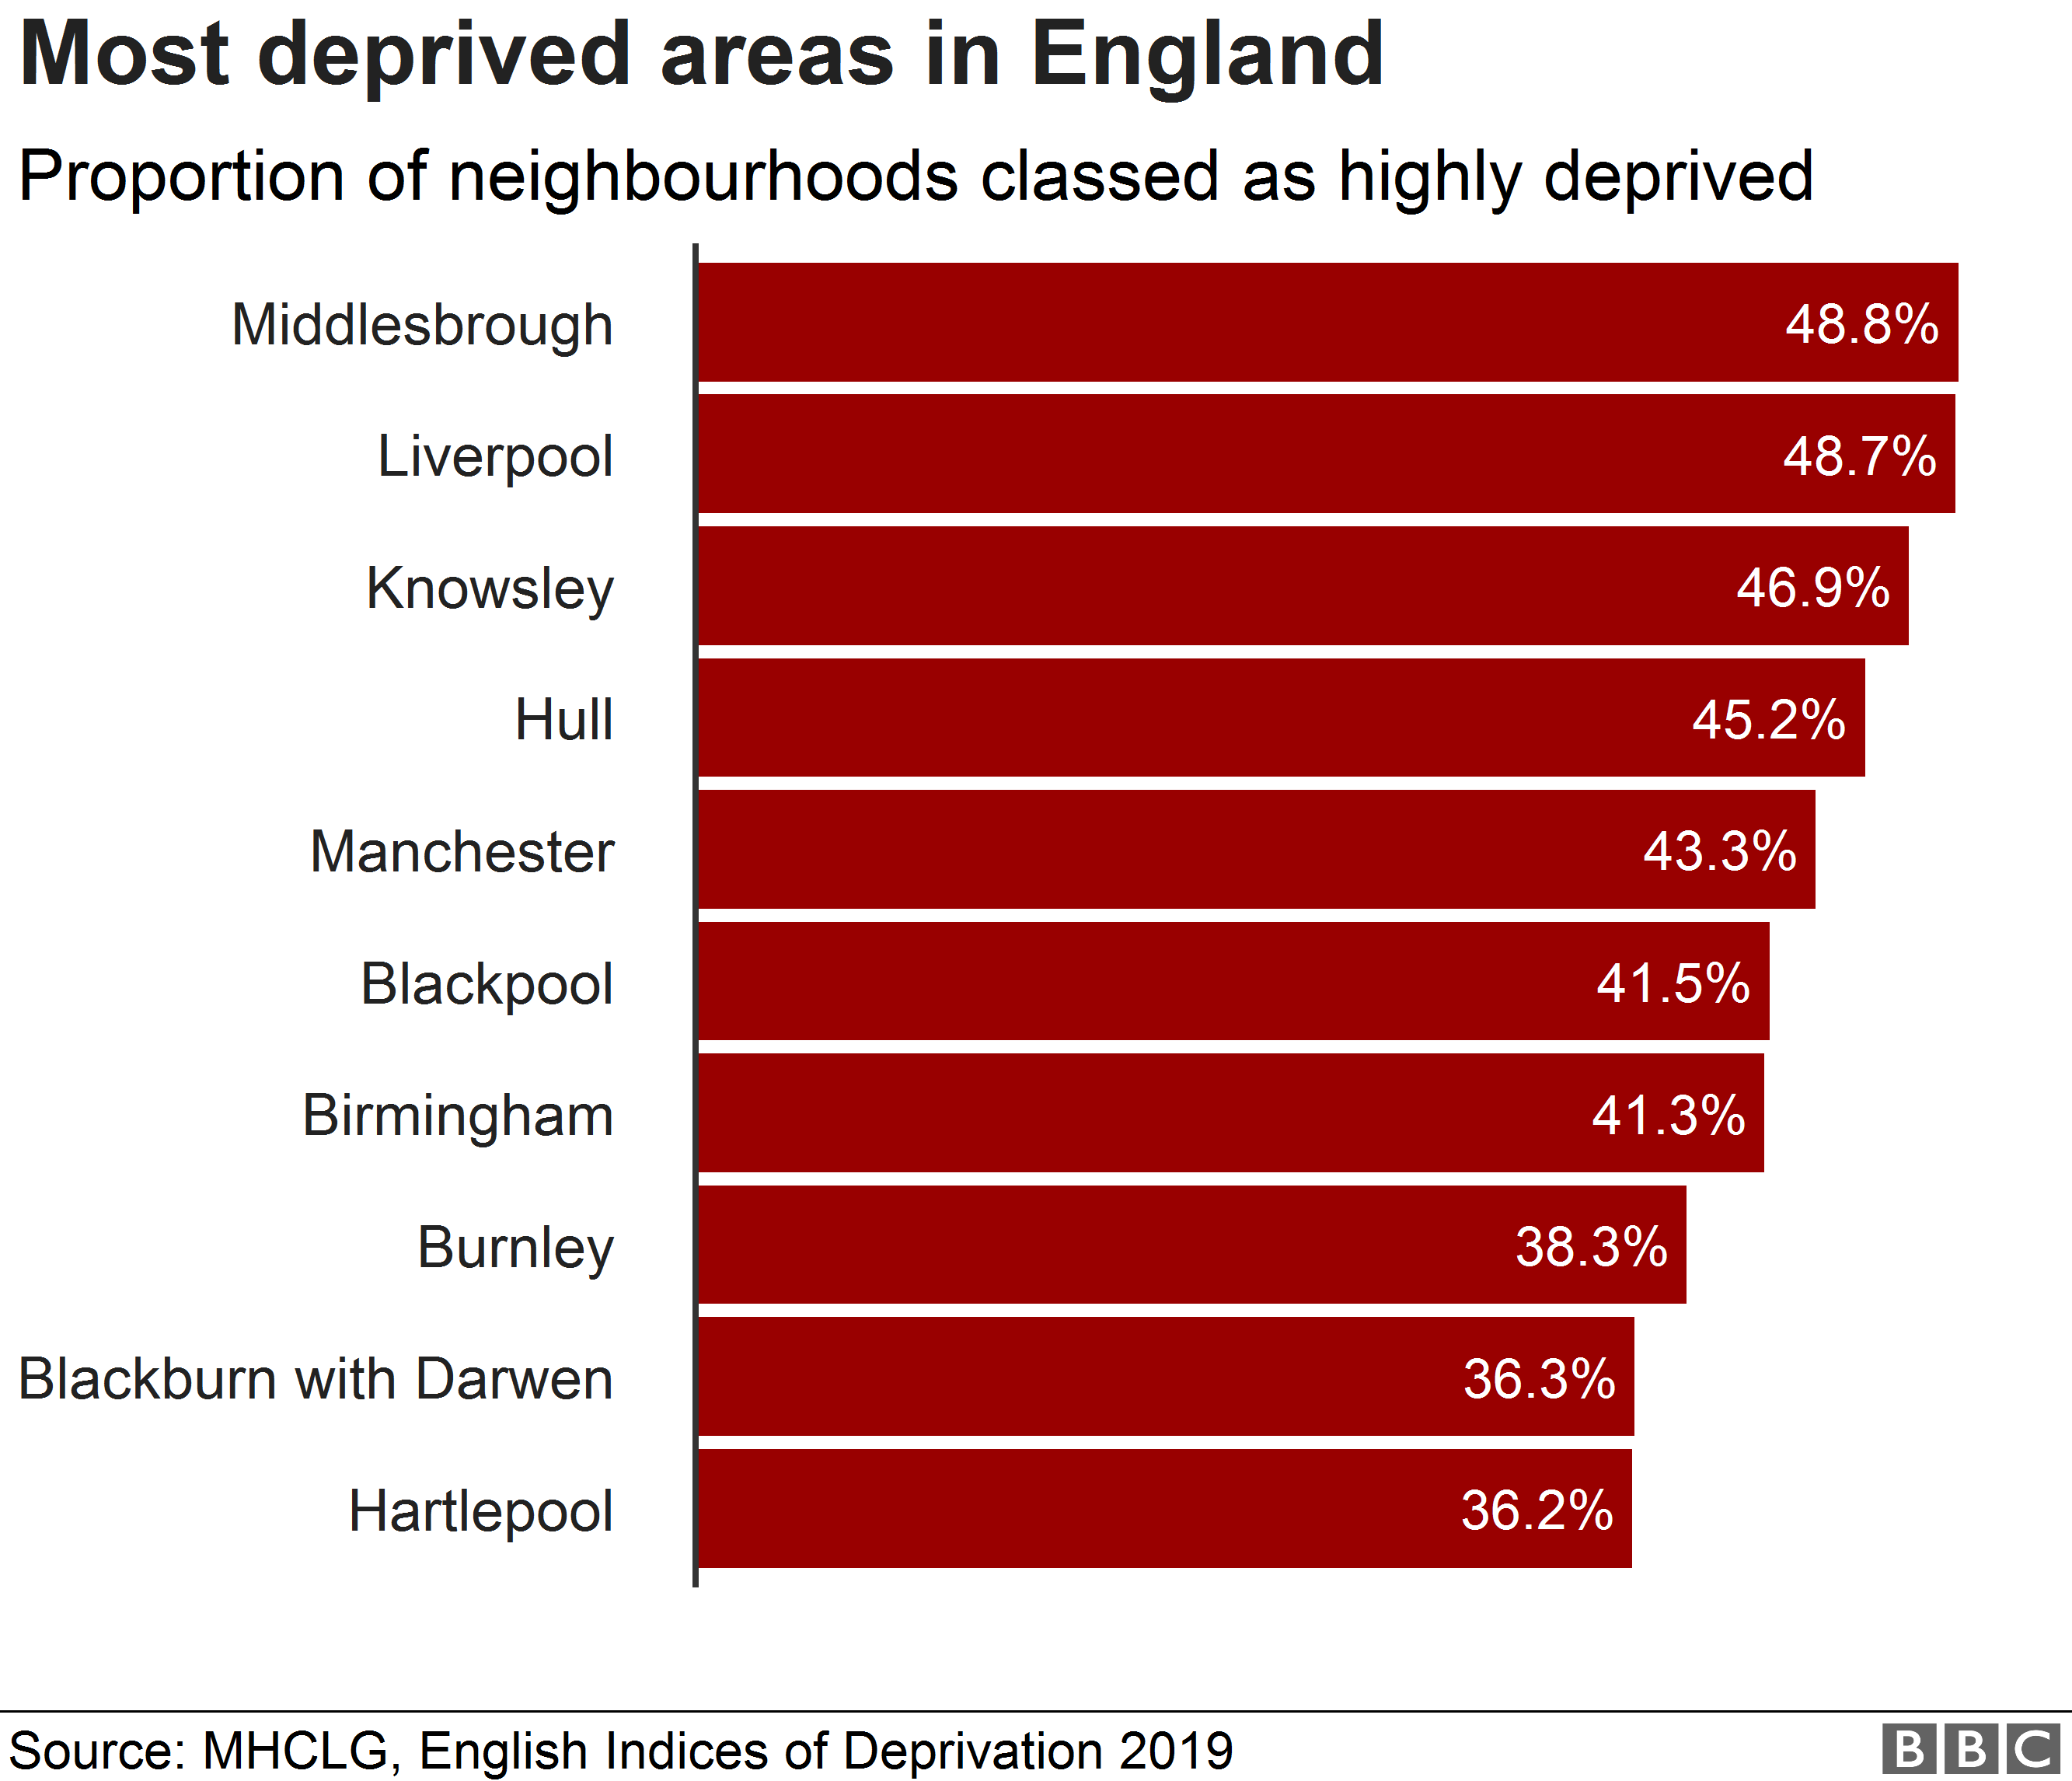
* Bar chart: Proportion of neighbourhoods classed as highly deprived (top 10)
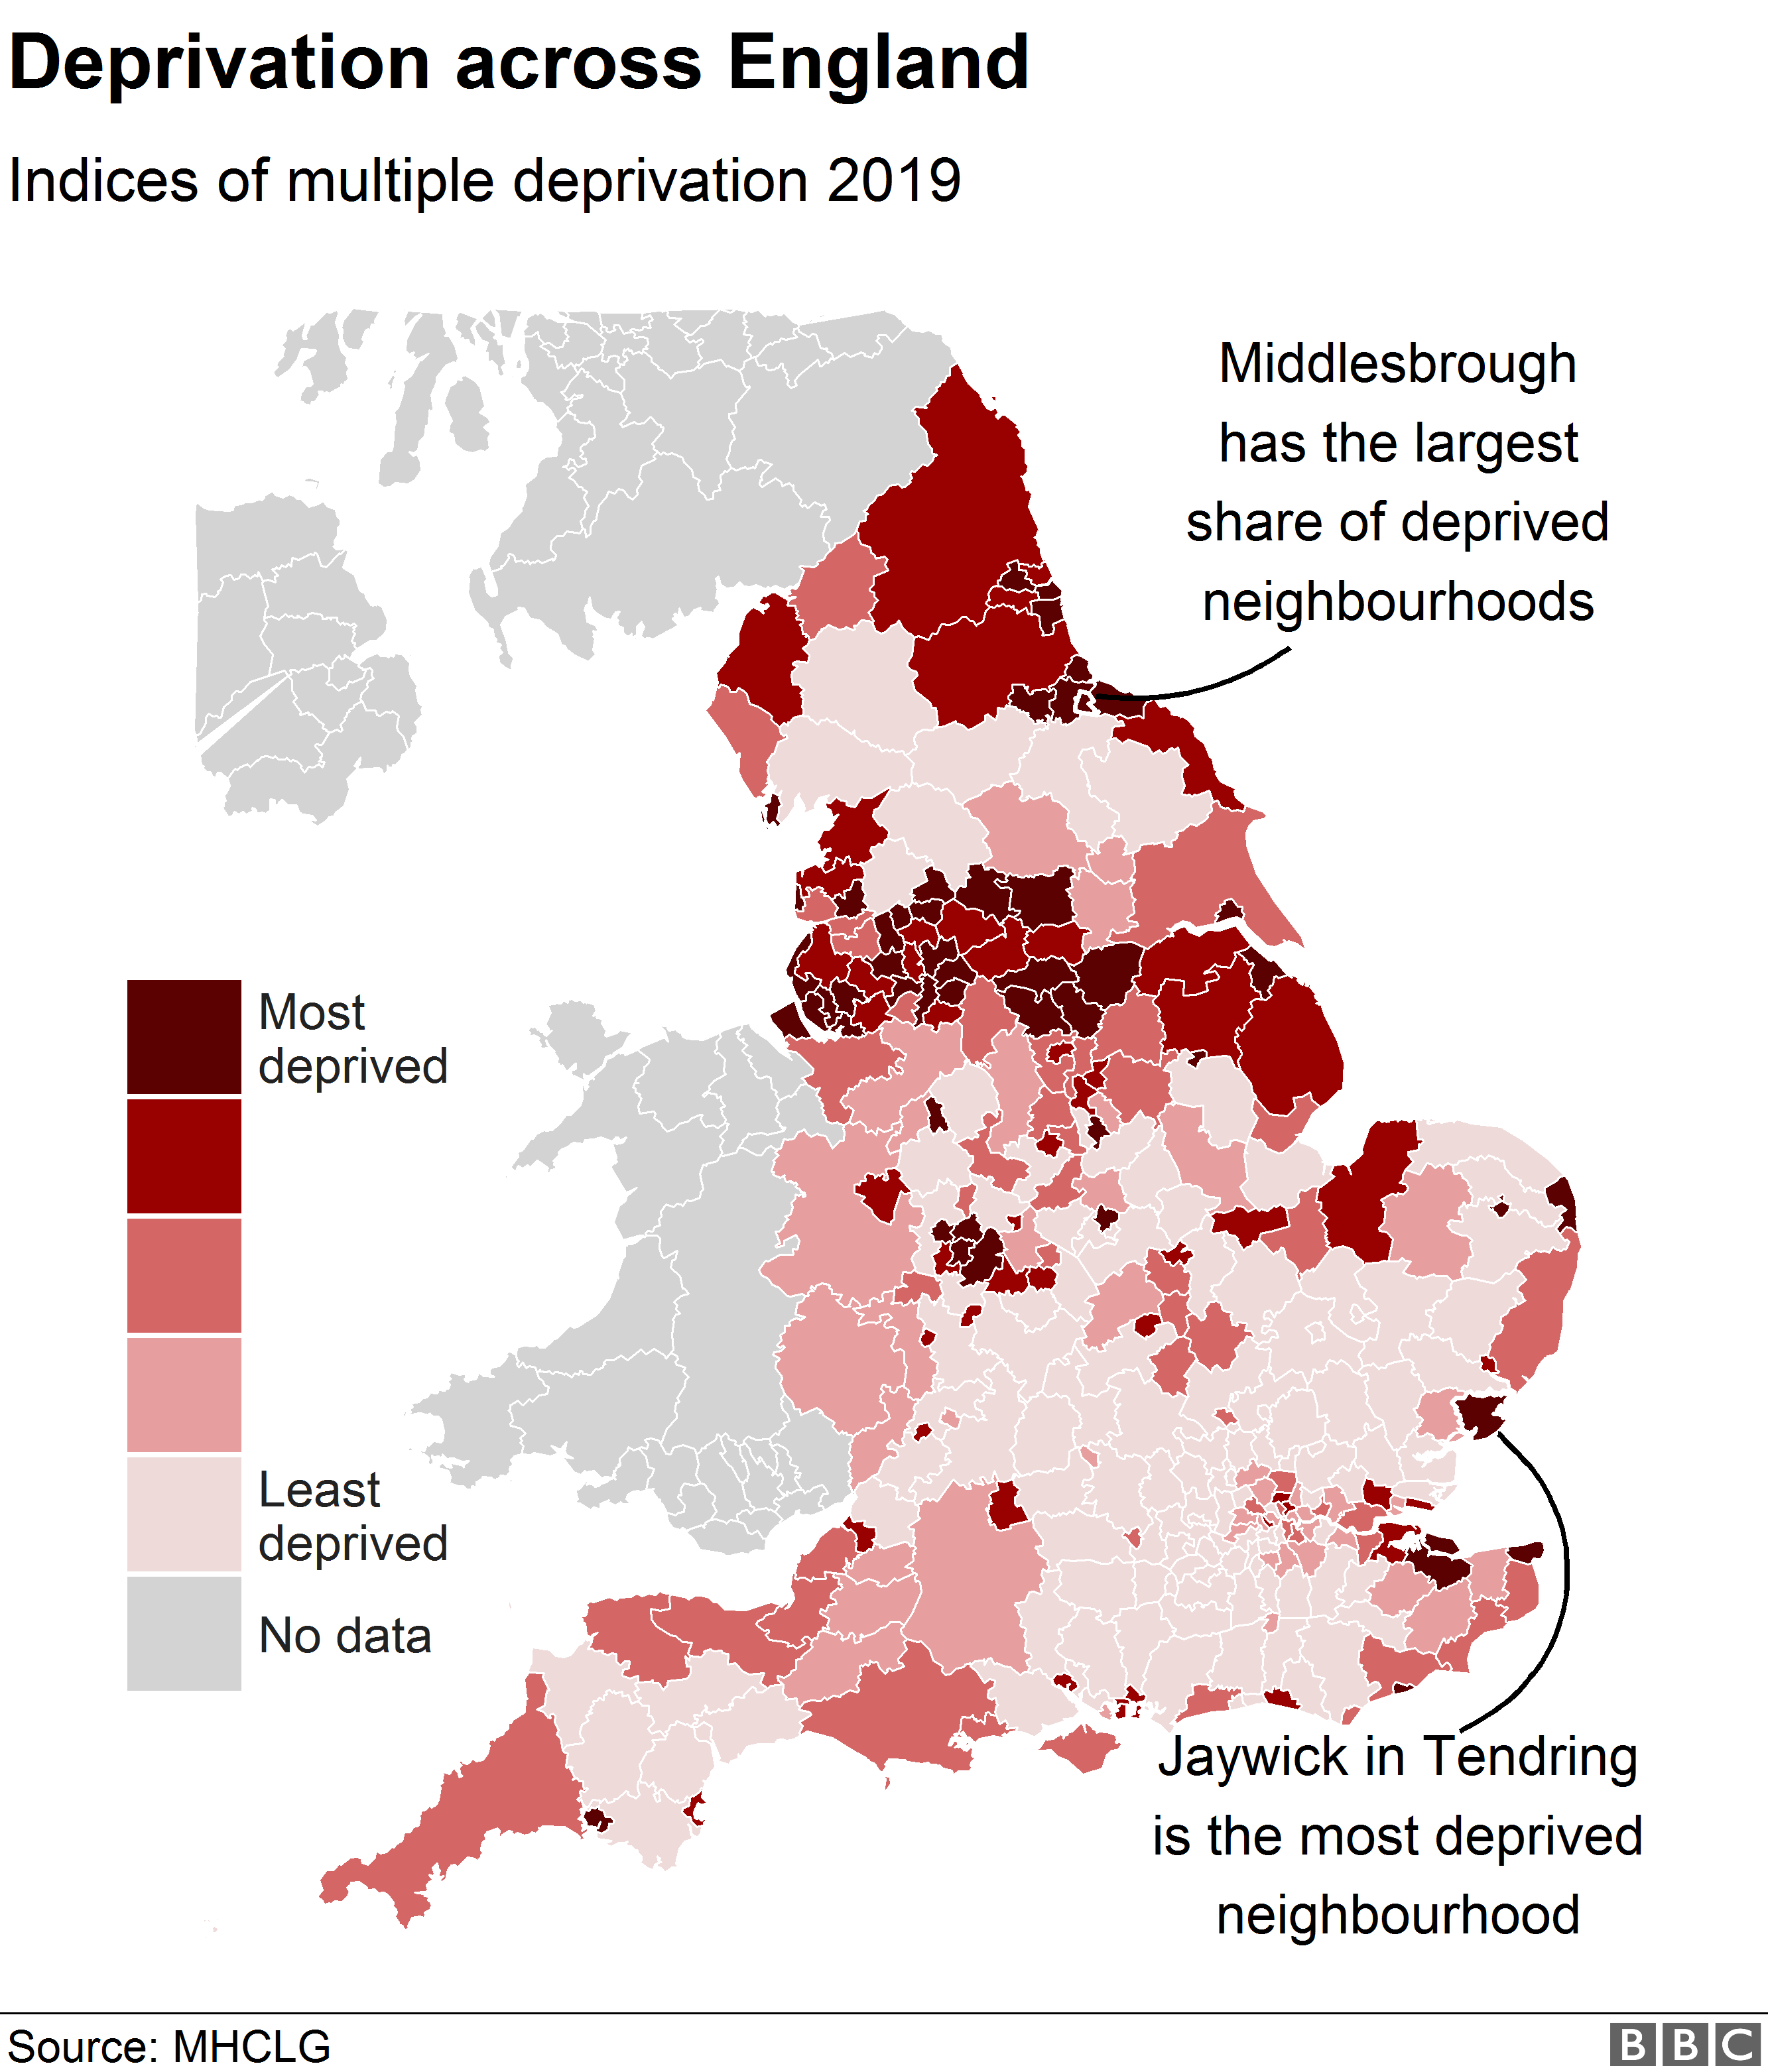
* Choropleth map: Deprivation across England
## Scripts and code
The story used R extensively to create scripts that would fetch the new data, combine it with previous data, and produce answers to particular questions:
* [R notebook: fetching data, cleaning, combining and producing a top/bottom 10](https://github.com/BBC-Data-Unit/deprivation/blob/master/id01_worstlsoa.Rmd)
* [R notebook: analysing the data to identify the most deprived local authority](https://github.com/BBC-Data-Unit/deprivation/blob/master/id02_worstla.Rmd)
* [R notebook: identifying areas which have changed the most on specific metrics](https://github.com/BBC-Data-Unit/deprivation/blob/master/id03_scorechanges.Rmd)
* [R notebook: analysing how scores have changed in England from 2010-2019](https://github.com/BBC-Data-Unit/deprivation/blob/master/id04_scoresoverall.Rmd)
## Related stories and repos
We have used deprivation data before in the data unit:
* You can [find all stories tagged 'deprivation' here](https://github.com/BBC-Data-Unit?utf8=%E2%9C%93&q=deprivation&type=&language=)