https://github.com/bbc-data-unit/hospital-beds
Bed delay transfer figures reveal areas worst affected
https://github.com/bbc-data-unit/hospital-beds
health hospitals
Last synced: 4 months ago
JSON representation
Bed delay transfer figures reveal areas worst affected
- Host: GitHub
- URL: https://github.com/bbc-data-unit/hospital-beds
- Owner: BBC-Data-Unit
- Created: 2017-03-24T09:43:38.000Z (over 8 years ago)
- Default Branch: master
- Last Pushed: 2017-03-24T10:53:55.000Z (over 8 years ago)
- Last Synced: 2024-12-27T08:40:16.956Z (6 months ago)
- Topics: health, hospitals
- Homepage: http://www.bbc.co.uk/news/uk-england-39258606
- Size: 82 KB
- Stars: 0
- Watchers: 5
- Forks: 0
- Open Issues: 0
-
Metadata Files:
- Readme: README.md
Awesome Lists containing this project
README
# Bed delay transfer figures reveal areas worst affected
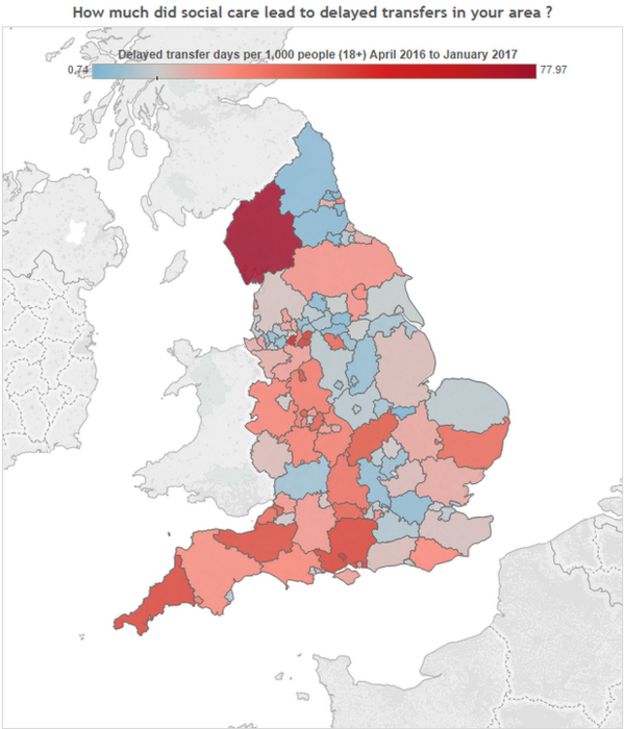
In March 2017 we [reported](http://www.bbc.co.uk/news/uk-england-39258606) that more than 2,500 hospital beds a day are taken up by patients whose release has been delayed due to problems in the social care system. We looked at delays caused by social care pressures. This could be delays in getting a home care package or nursing home placement.
* On average, there are 12 days lost per 1,000 people aged 18 and over across 151 areas.
* There are wide variations across the country. Cumbria County Council had the highest rate of delays in England, with 78 days per 1,000 people.
* Delays due entirely to social care have more than doubled in the past five years.
The story was based on data compiled from monthly [NHS England statistics on delayed transfers of care](https://www.england.nhs.uk/statistics/statistical-work-areas/delayed-transfers-of-care/).
# Get the data
* [Google spreadsheet: Delayed days of care transfer where social care was a factor](https://docs.google.com/spreadsheets/d/1VknPvM9wuiA6_-kY9ODM_dbbNSKwHJECyRpRKPKLCfg/edit#gid=0)
* [ CSV: Additional funding for adult social care announced at Budget 2017 by year](https://github.com/BBC-Data-Unit/hospital-beds/blob/master/Additional%20funding%20for%20adult%20social%20care%20announced%20at%20Budget%202017%20by%20year.csv) / [raw](https://raw.githubusercontent.com/BBC-Data-Unit/hospital-beds/master/Additional%20funding%20for%20adult%20social%20care%20announced%20at%20Budget%202017%20by%20year.csv)
* [CSV: Delayed days of care transfer where social care was a factor by local authority](https://github.com/BBC-Data-Unit/hospital-beds/blob/master/Delayed%20days%20of%20care%20transfer%20where%20social%20care%20was%20a%20factor%20by%20LA.csv) / [raw](https://raw.githubusercontent.com/BBC-Data-Unit/hospital-beds/master/Delayed%20days%20of%20care%20transfer%20where%20social%20care%20was%20a%20factor%20by%20LA.csv)
# Visualisation
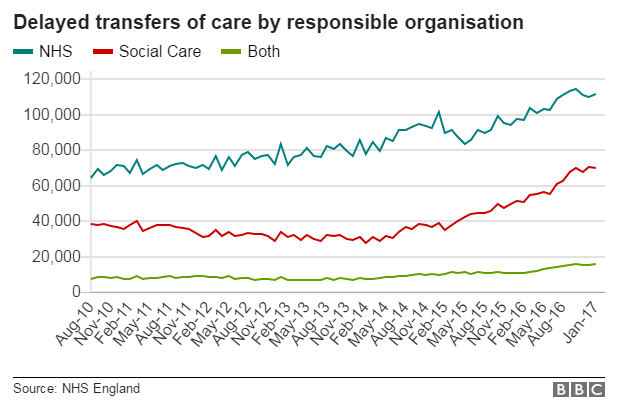
* Line chart: Delayed transfers of care by responsible organisation
* Bar chart: Areas with the most delayed transfers of care
* Infographic: The extra £2 billion: Who gets what?
* [Interactive map: How much did social care lead to delayed transfers in your area?](https://public.tableau.com/profile/daniel.wainwright4535#!/vizhome/DelayedTransfersofCare/Dashboard1)