https://github.com/be-hase/kafka-elasticsearch-metrics-reporter
Kafka Elasticsearch Metrics Reporter
https://github.com/be-hase/kafka-elasticsearch-metrics-reporter
Last synced: about 1 month ago
JSON representation
Kafka Elasticsearch Metrics Reporter
- Host: GitHub
- URL: https://github.com/be-hase/kafka-elasticsearch-metrics-reporter
- Owner: be-hase
- License: mit
- Created: 2016-01-19T12:03:14.000Z (almost 10 years ago)
- Default Branch: master
- Last Pushed: 2016-02-03T08:41:43.000Z (over 9 years ago)
- Last Synced: 2025-08-11T09:33:17.619Z (3 months ago)
- Language: Java
- Size: 769 KB
- Stars: 1
- Watchers: 3
- Forks: 2
- Open Issues: 0
-
Metadata Files:
- Readme: README.md
- License: LICENSE
Awesome Lists containing this project
README
[](https://travis-ci.org/be-hase/kafka-elasticsearch-metrics-reporter)
# kafka-elasticsearch-metrics-reporter
This is repoter for kafka.
This send metris data to Elasticseach.
# Requirements
* >= kafka 0.8.2.0
* Maybe it works 0.8.1.x, but I didn't confirm.
* elasticsearch
* I tested with 2.1(latest).
* Maybe it works <= 2.1(latest), but I didn't confirm.
# Install on broker.
1. Build this project using `mvn clean package -DskipTests` or download jar from [here](https://github.com/be-hase/kafka-elasticsearch-metrics-reporter/releases/download/v1.1.0/kafka-elasticsearch-metrics-reporter-1.1.0-shaded.jar).
2. Add `kafka-elasticsearch-metrics-reporter-1.1.0-shaded.jar` to the `libs/` directory of your kafka broker installation.
3. Configure the broker (see the configuration section below).
4. Restart the broker.
# Configuration
Edit the server.properties file of your installation, activate the reporter by setting:
```
# kafka properties
kafka.metrics.reporters=com.behase.kafka.KafkaElasticsearchMetricsReporter
kafka.metrics.polling.interval.secs=10
# kafka-elasticsearch-metrics-reporter properties
kafka.elasticsearch.metrics.nodes=:
kafka.elasticsearch.metrics.reporter.enabled=true
```
Here is a list of properties.
| property name | default | required | description |
| --- | --- | --- | --- |
| kafka.elasticsearch.metrics.nodes | | Y | Host and IP of your elasticsearch nodes. (Comma separated) |
| kafka.elasticsearch.metrics.indexPrefix | kafka-metrics- | | Prefix of elasticsearch index. |
| kafka.elasticsearch.metrics.ttl | | | TTL (time to live) |
| kafka.elasticsearch.metrics.getVmInfo | true | | If this is true, you can get JVM metrics. |
| kafka.elasticsearch.metrics.reporter.enabled | false | | If you want to use kafka-elasticsearch-metrics-reporter, set true.|
| kafka.elasticsearch.metrics.enableReset | true | | If you want to reset count and histogram, set true.|
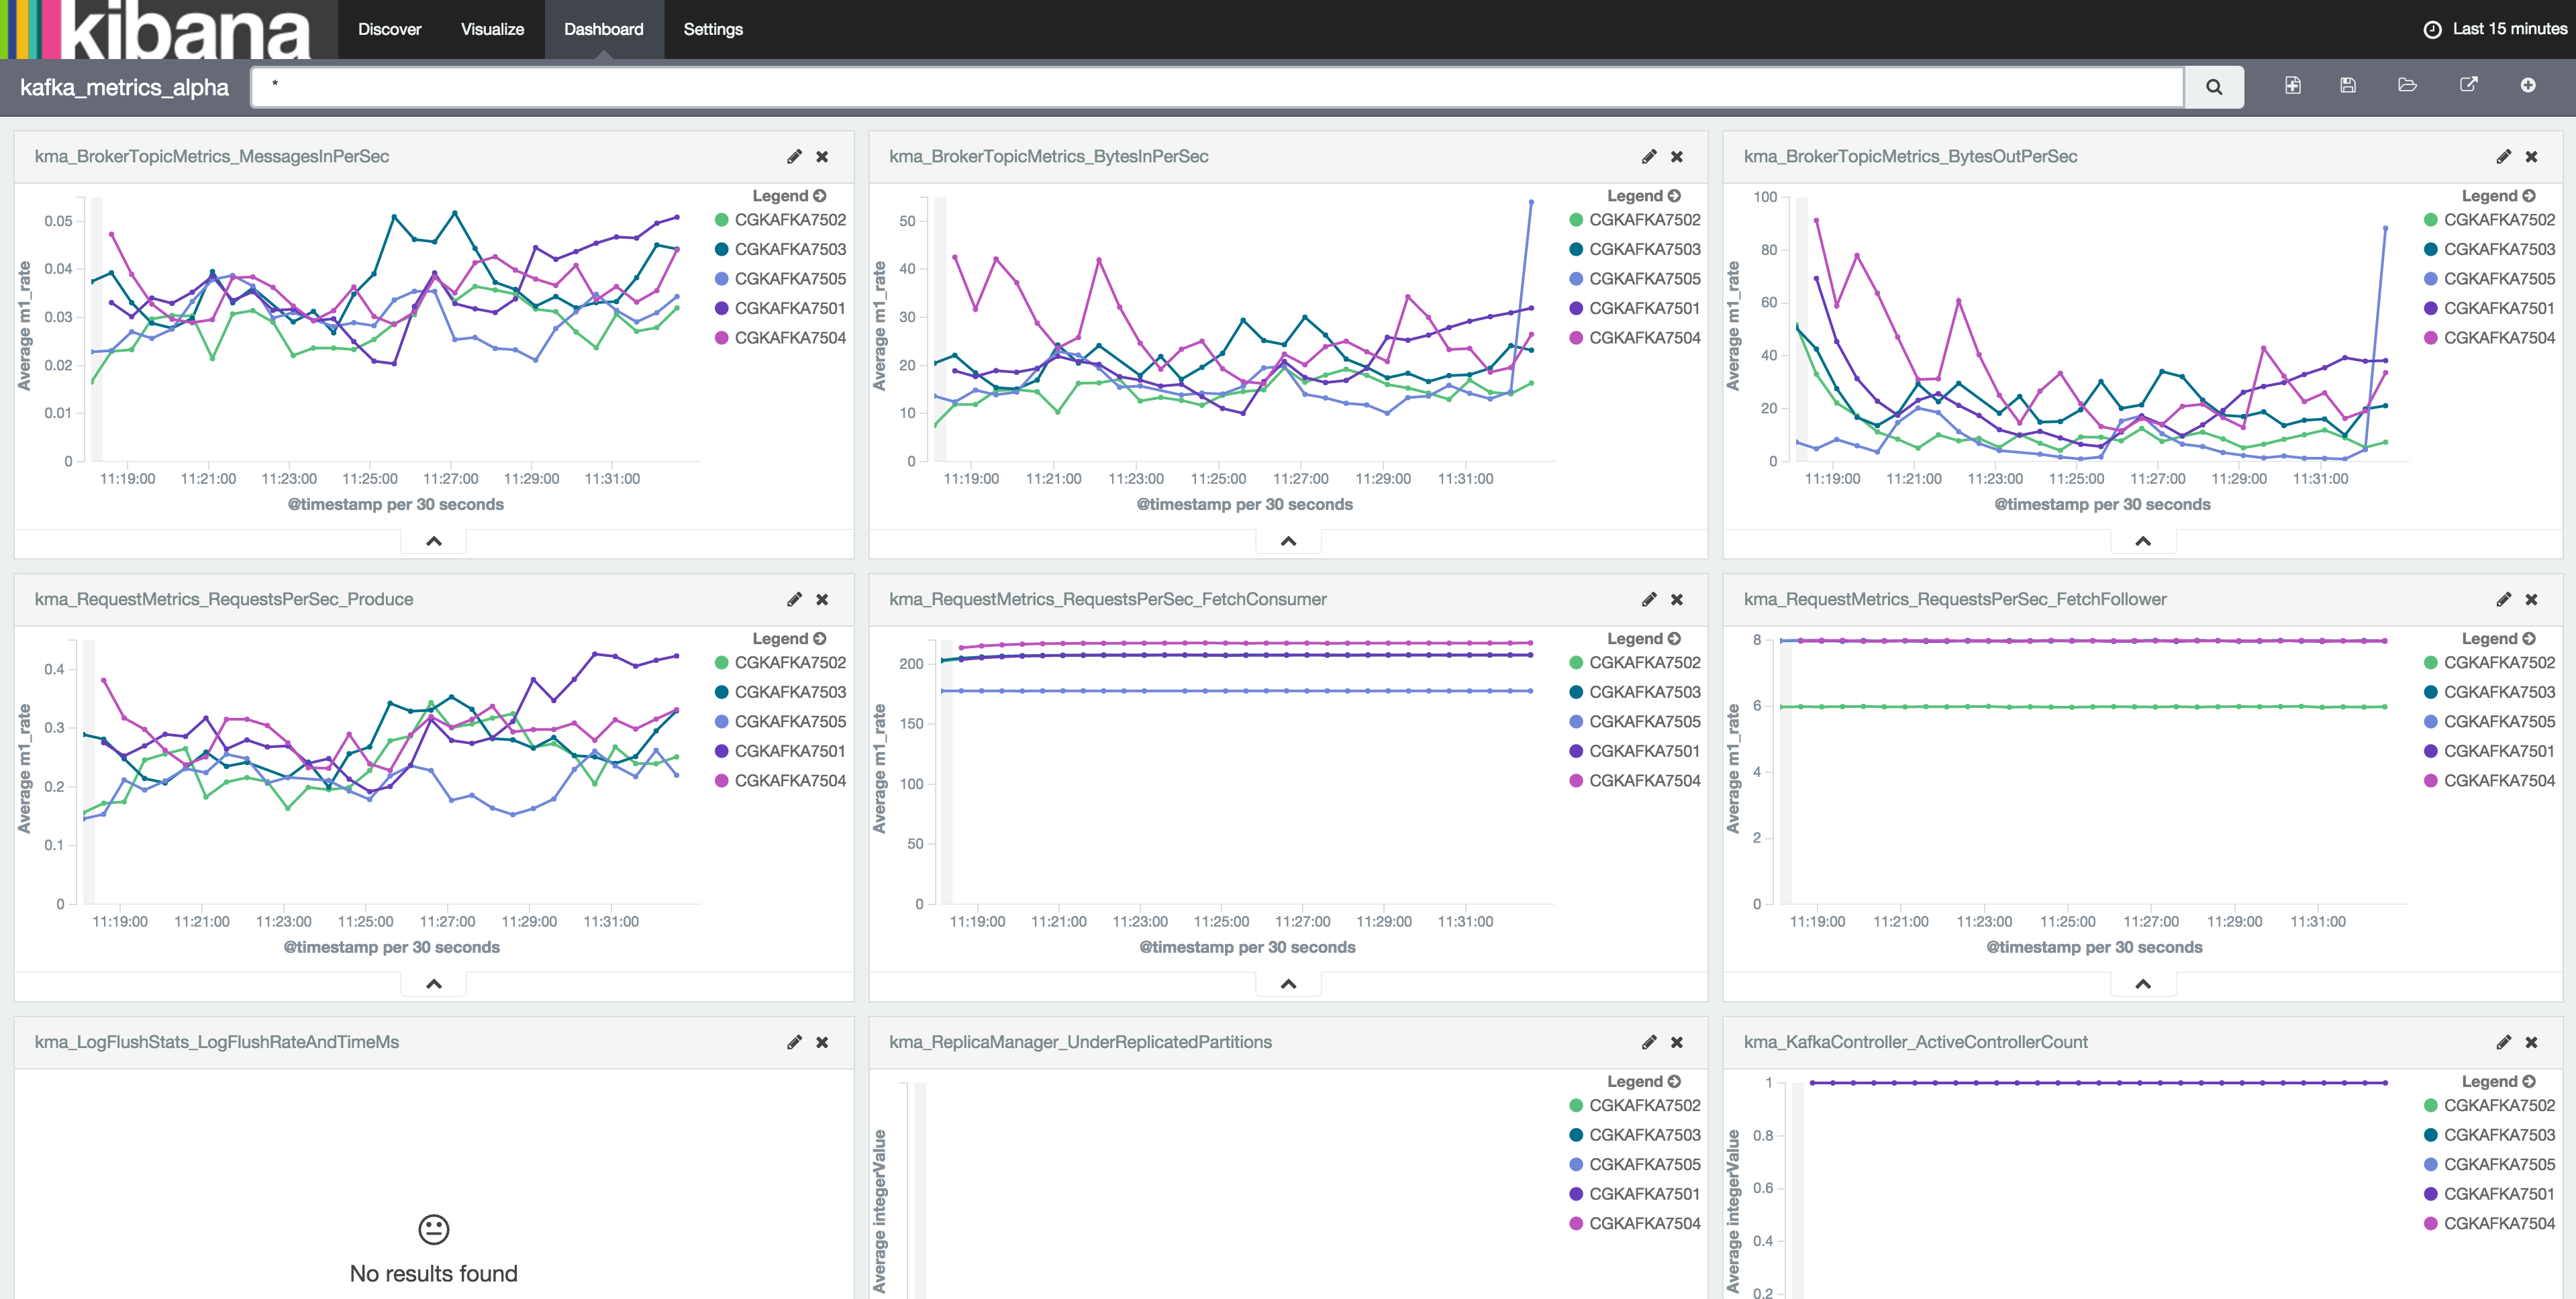
# Visualize by your kibana

# Contribution
Welcome !!
I use Docker as test environment.
Please see `.travis.yml`