https://github.com/benyamindsmith/starBliss
Create beautiful, print quality maps of the night sky in R
https://github.com/benyamindsmith/starBliss
Last synced: 8 months ago
JSON representation
Create beautiful, print quality maps of the night sky in R
- Host: GitHub
- URL: https://github.com/benyamindsmith/starBliss
- Owner: benyamindsmith
- Created: 2023-01-11T22:34:45.000Z (over 3 years ago)
- Default Branch: main
- Last Pushed: 2023-03-10T19:54:34.000Z (over 3 years ago)
- Last Synced: 2024-07-18T02:49:18.856Z (almost 2 years ago)
- Language: R
- Size: 12.2 MB
- Stars: 43
- Watchers: 3
- Forks: 2
- Open Issues: 6
-
Metadata Files:
- Readme: README.md
Awesome Lists containing this project
- awesome-ggplot2 - starBliss
README
# starBliss 
Initially inspired by an issue posted on the [`mapBliss`](https://github.com/benyamindsmith/mapBliss/issues/10) package. The goal of this package is to create print quality starmap art similar to what is available online on many websites like [Maps For Moments](https://mapsformoments.co.uk) and [Etsy](https://www.etsy.com/ca/market/star_map) within the R console.
As is the case with all projects. This one is a work in progress. So this repository will change over time!
Installing this package
```r
# install.packages("devtools")
devtools::install_github("benyamindsmith/starBliss")
```
Why this isn't included in `mapBliss`
The `mapBliss` package utlizes leafleat and creates dynamic maps which can be screenshot to make custom maps. For visualization `starBliss` uses `ggplot2` creates static visuals which can be saved by using the `ggsave`. Since the approaches to making visuals were so different, I thought it was best make keep `mapBliss` and `starBliss` seperate in their construction.
Dependencies
This package has the following dependencies:
(In no particular order)
* `dplyr`
* `ggplot2`
* `magrittr`
* `tidygeocoder`
* `sf`
* `lubridate`
* `tibble`
* `grid`
* `s2`
Basic Usage/Sample Visuals
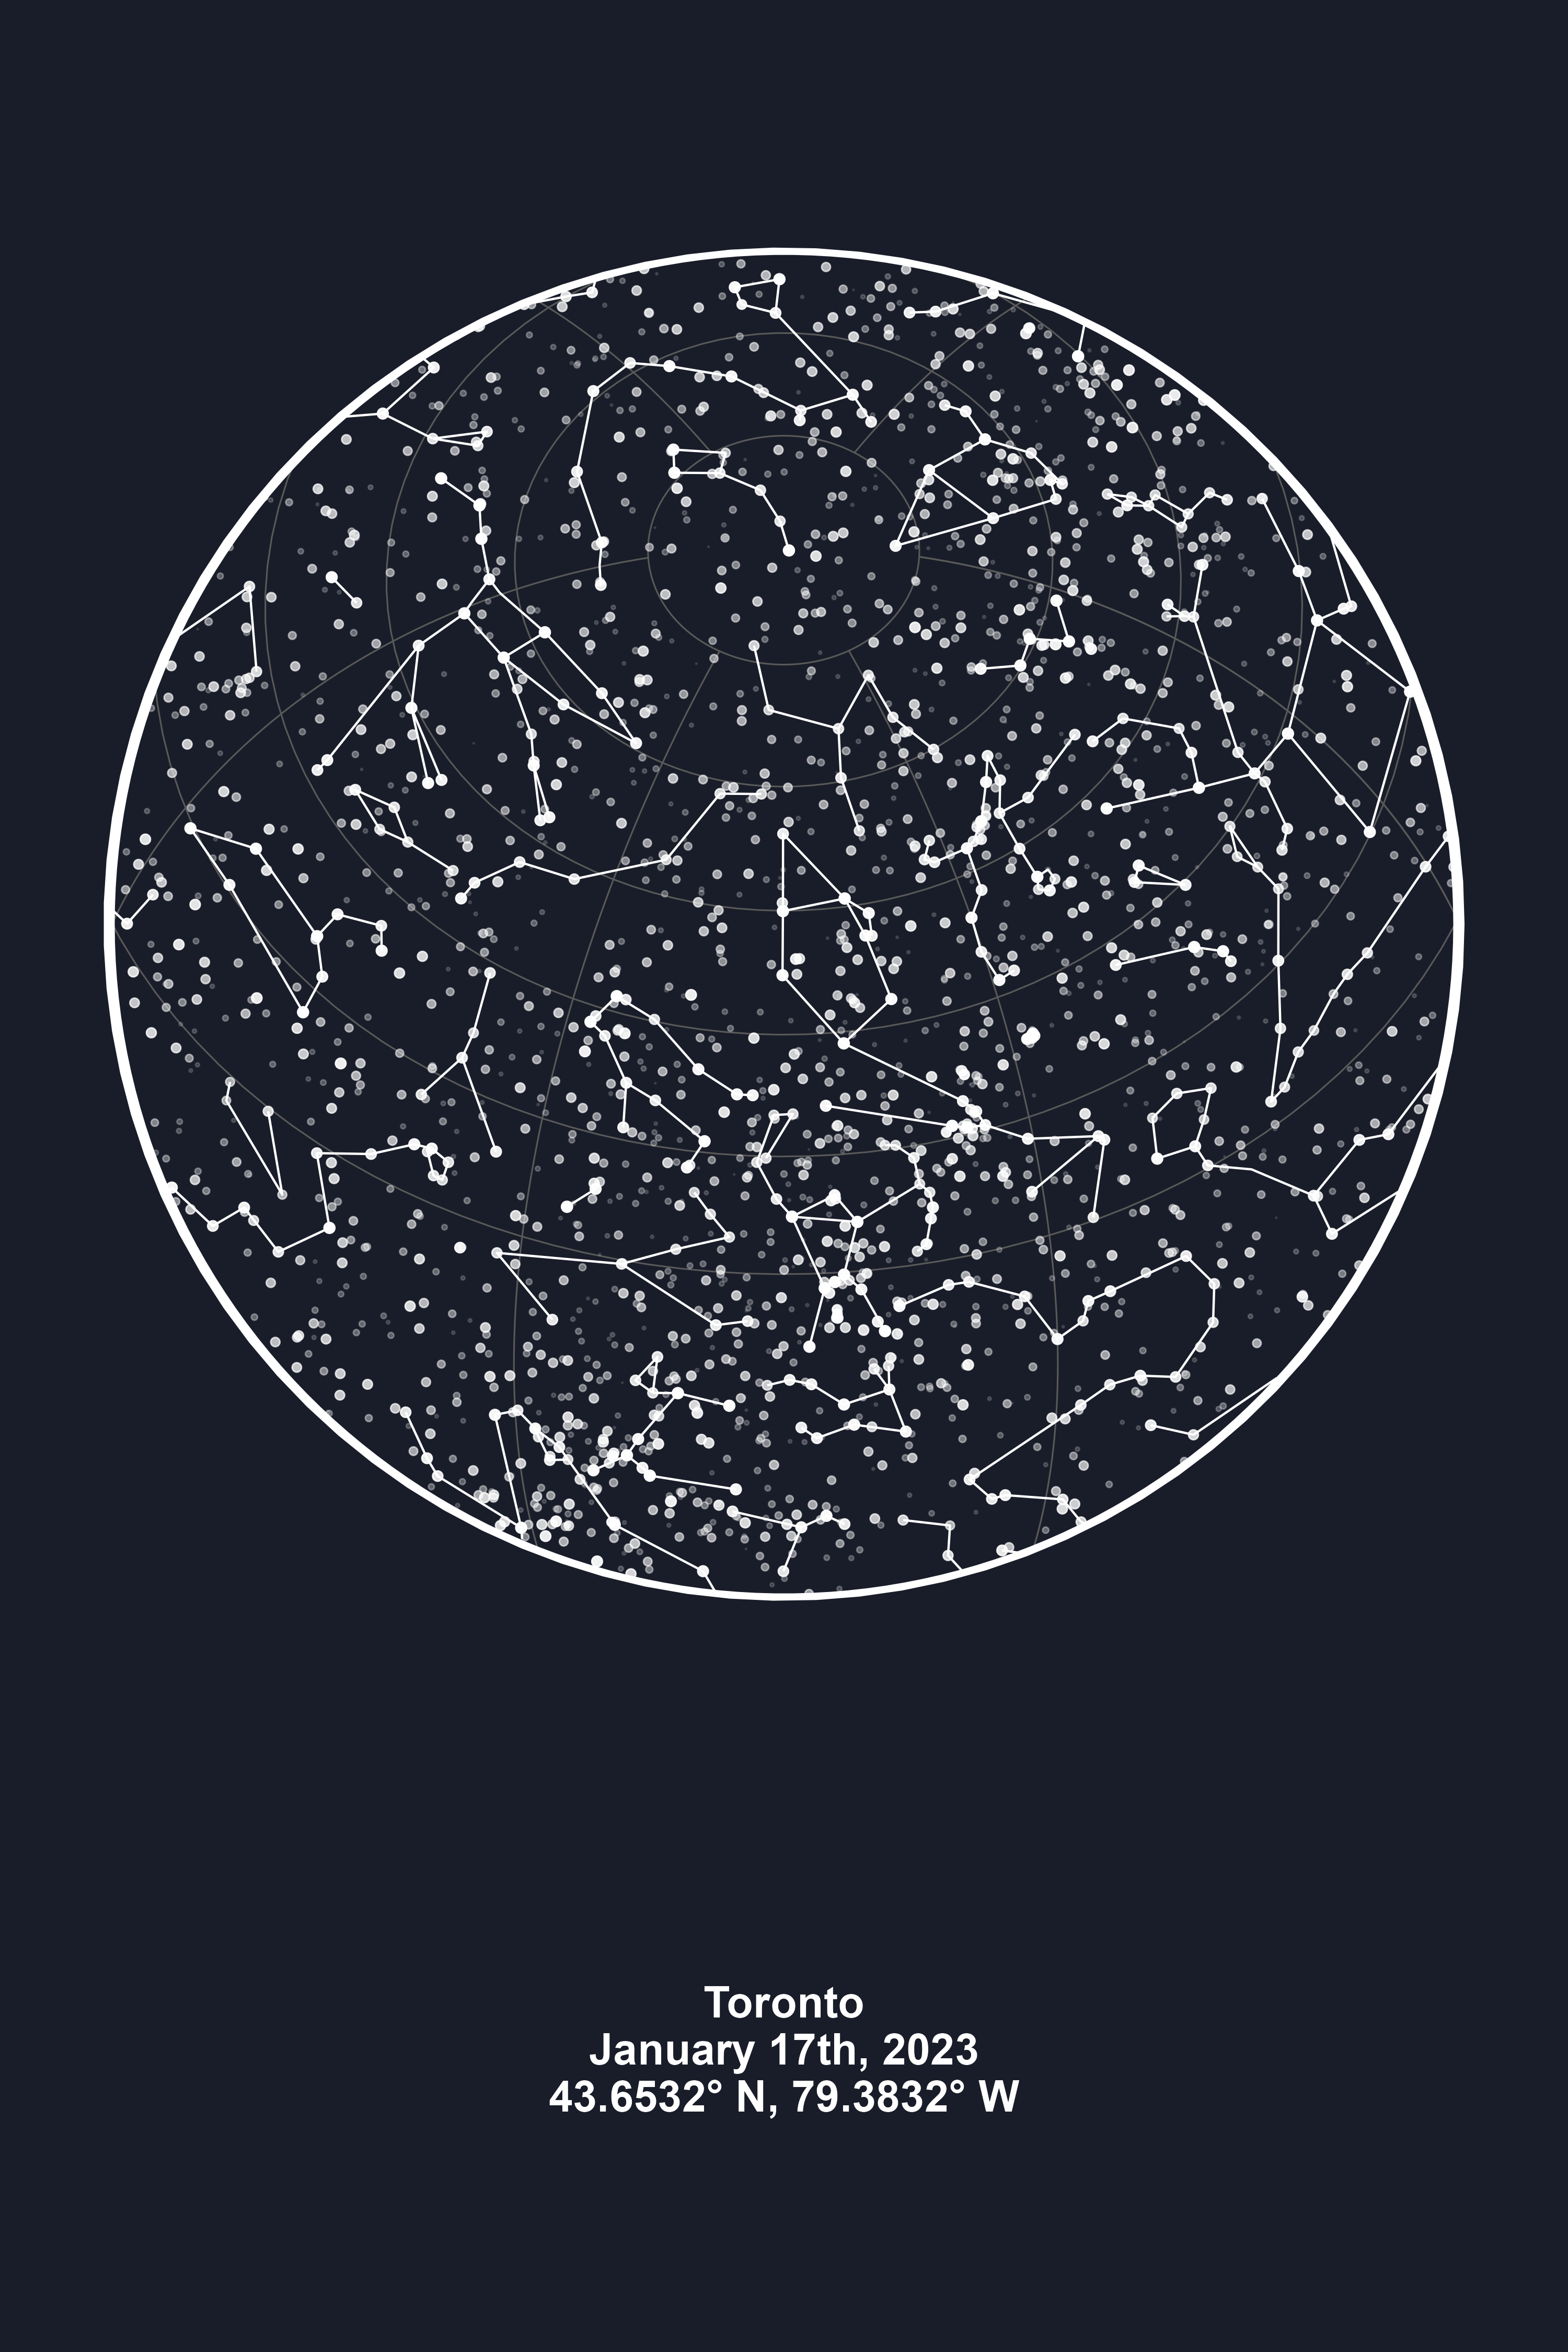
"Black" Style
```r
library(ggplot2)
library(starBliss)
p<- plot_starmap(location= "Toronto, ON, Canada",
date="2022-01-17",
style="black",
line1_text="Toronto",
line2_text ="January 17th, 2023",
line3_text="43.6532° N, 79.3832° W")
ggsave('toronto_black.png', plot = p, width = unit(10, 'in'),
height = unit(15, 'in'))
```
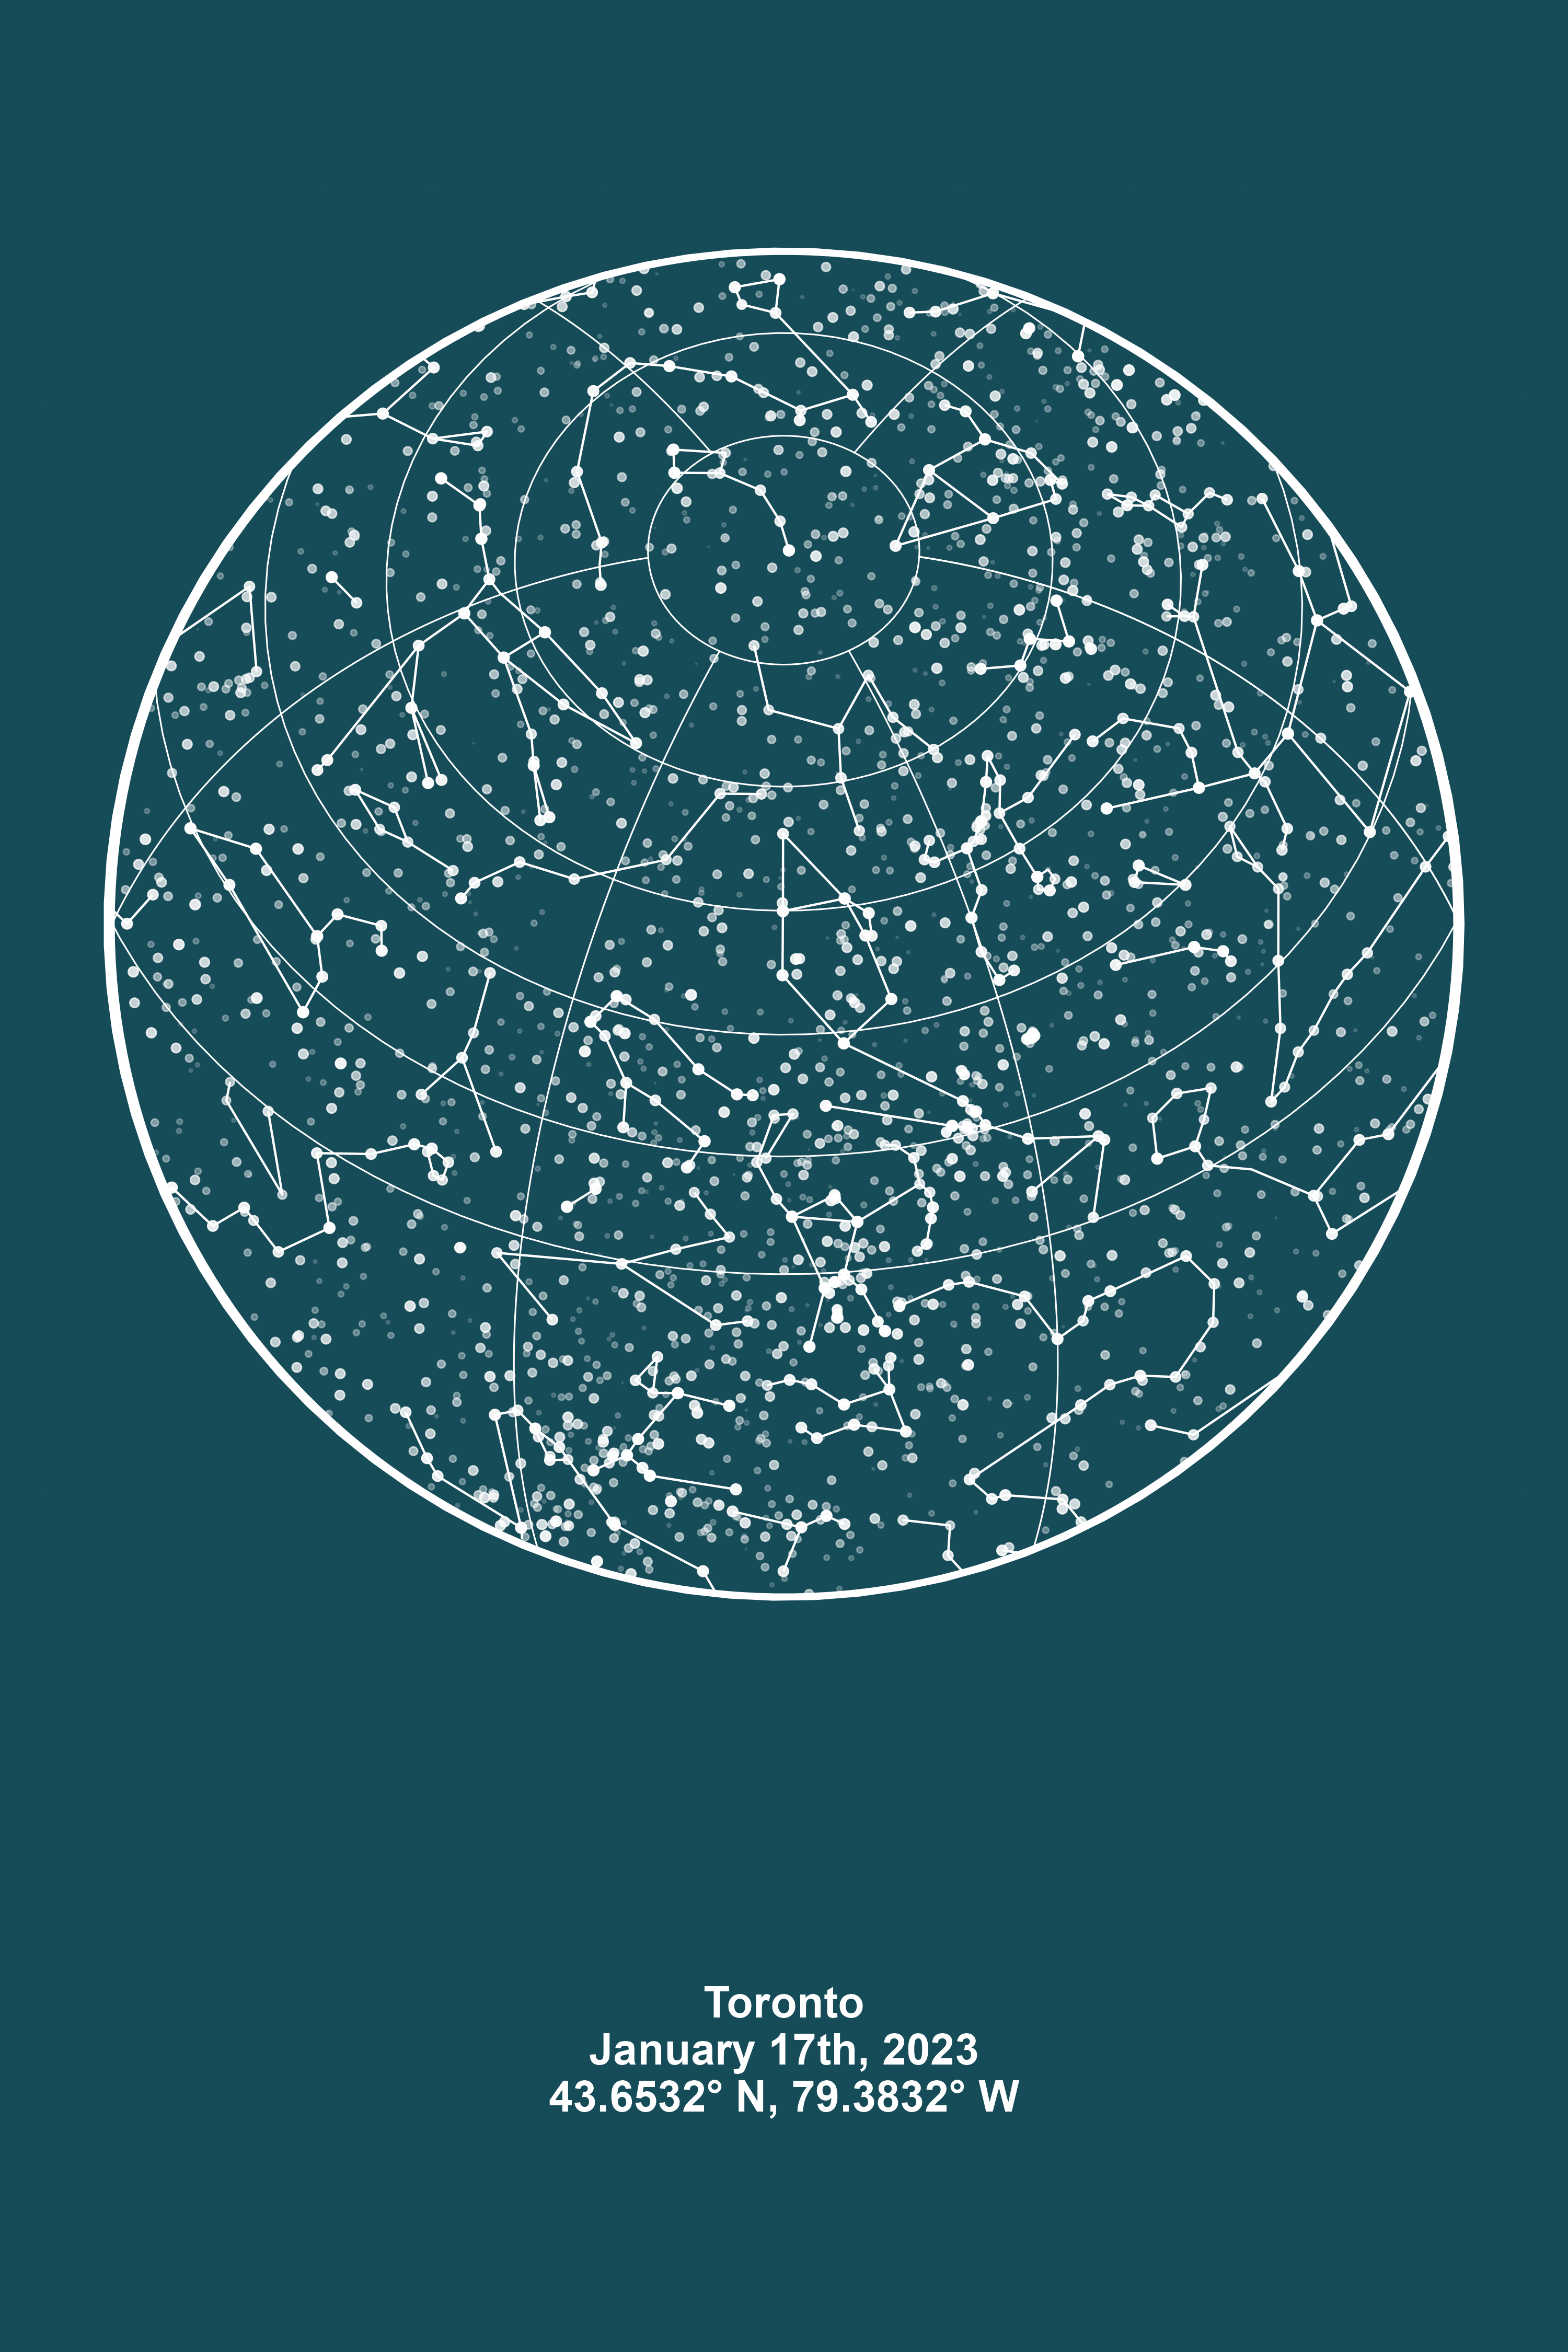
"Green" Style
```r
library(ggplot2)
library(starBliss)
p<- plot_starmap(location= "Toronto, ON, Canada",
date="2022-01-17",
style="green",
line1_text="Toronto",
line2_text ="January 17th, 2023",
line3_text="43.6532° N, 79.3832° W")
ggsave('toronto_green.png', plot = p, width = unit(10, 'in'),
height = unit(15, 'in'))
```
Using the Web App
If using the R console is not something you're interested in doing. I created a [Shiny App](https://github.com/benyamindsmith/starBlissGUI) that you can check out and use. Check out the [hosted version](https://benyamindsmith.shinyapps.io/starBlissGUI/) on shinyapps.io
Acknowledgements
This package is largely based on the heavy lifting done by other talented developers. Among them including:
* [Kim Fitter](https://github.com/kimnewzealand) for her [Celestial Maps in R](https://kimnewzealand.github.io/2019/02/21/celestial-maps/) blog.
* [Allan Cameron](https://stackoverflow.com/users/12500315/allan-cameron) for [supplying the code](https://stackoverflow.com/questions/75064069/creating-star-map-visualizations-based-on-location-and-date/75064359#75064359) which got this started.
* [Bernardo Lares](https://github.com/laresbernardo) for opening up issues!
* [Diego Hernangómez](https://github.com/dieghernan) for helping with the [constellation lines problem](https://stackoverflow.com/questions/75205747/how-to-remove-random-diagonal-lines-from-star-map-vizualizations-produced-by-geo/75212722#75212722) and for helping with making a [rotation function](https://github.com/benyamindsmith/starBliss/pull/10) which accurately matches MapsForMoments.