https://github.com/bjyurkovich/escher-interactive
Demonstration project for extending Escher
https://github.com/bjyurkovich/escher-interactive
Last synced: 3 months ago
JSON representation
Demonstration project for extending Escher
- Host: GitHub
- URL: https://github.com/bjyurkovich/escher-interactive
- Owner: bjyurkovich
- Created: 2017-03-02T15:51:52.000Z (over 8 years ago)
- Default Branch: master
- Last Pushed: 2017-05-08T21:40:59.000Z (about 8 years ago)
- Last Synced: 2025-01-21T06:43:30.450Z (5 months ago)
- Language: JavaScript
- Size: 15.2 MB
- Stars: 2
- Watchers: 3
- Forks: 0
- Open Issues: 0
-
Metadata Files:
- Readme: README.md
Awesome Lists containing this project
README
# Escher Interactive
This repository houses the code for [Escher-Interactive](http://escher-interactive.ucsd.edu), a project that builds off of [Escher](http://escher.github.io) to meet a specific set of design needs:
- inclusion of data plots on an Escher map
- boxes that appear when users mouse over elements on a map (Escher tooltips)
Escher Interactive was developed by the [Systems Biology Research Group](http://sbrg.ucsd.edu) at the University of California, San Diego.
## Introduction
For biological domain experts who rely heavily on existing software (both commercial and open source), one of the primary obstacles is the time and effort required to learn, extend, and deploy existing software platforms within the context of their research. Within the framework of research oriented software development, the typical attitude taken by these researchers is to treat the software development as a means to an end, where “quick and dirty” is valued over elegance in design. In the next sections, a case study is introduced where an existing open source project was leveraged and extended in the context of RBC modeling and visualization. Through the course of the development, a focus on "quick and dirty" was employed while attempting to maintain good architecture for future extensibility and scalability.
## Background on the Authors
As in any case study, it is helpful to provide some background on the skills and background of the authors to put into context the approach that was taken. The development was completed by two primary contributors. The first contributor (James) is a 3rd year Bioinformatics PhD student with a background in Python, MATLAB, and rudimentary exposure to javascript, HTML, and CSS. While James has enough software design and programming experience to efficiently meet his modeling and simulation needs within the context of his research on dynamic biological systems, he has minimal formal experience and background in software architecture and programming. James’ formal training is in Electrical Engineering and Biological Systems.
The second contributor (BJ) has a formal training in computer science and mechanical engineering, with a basic secondary-school understanding of biological systems. BJ professionally develops web-based APIs and web-based visualization techniques in addition to developing and and performing university-oriented research on topics related to modeling and simulation of dynamic energy systems.
Through an intense 4 day collaborative session, both James and BJ were able to extend the existing open source Escher code-base with very minimal assistance from its core developer (Zak) in include basic interactive functionality overlaid on an Escher map.
## Technology Stack
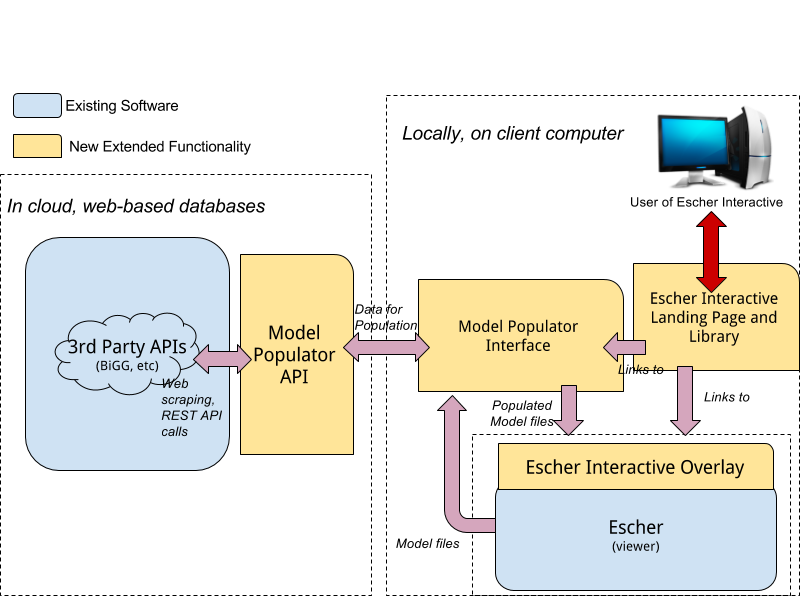
With the primary goal to provide users with the ability to access on-demand information about metabolites and reactions within an existing Escher model viewer, the basic Escher project developed by Zak (escher.github.io) was cloned from Github as a starting point. Through a quick 20 minute discovery process, it was determined that a number of primary items were needed:
1. **Escher Project:** The base, self-contained Escher library that was used was written in javascript ([ES5](https://es5.github.io), [requirejs](http://requirejs.org/)). It was decided to start from the existing builder and viewer tool provided in the open source Escher project that also contained an algebraic solver and general loader framework.
2. **Data APIs:** Open access to web based APIs (application programming interface) to gather necessary data shown in the data overlays: BiGG, Chebi, KEGG, PDB (protein images), and other miscellaneous chart and plot images. REST (representational state transfer) APIs were preferred, but did not exist for many of the data sources, so web-page scraping needed to be employed.
3. **Escher Interactive Model Populator:** The Escher JSON models that are used in the standard Escher viewer and builder do not provide the necessary information to be displayed within the Escher Interactive overlay. Thus, a simple web tool to take an existing model file and populate it was required. Since this was a stand-alone interface and tool that would utilize an API to populate the necessary data and output an updated model file, the React framework (javascript) was used because of familiarity.
4. **Escher Interactive Visual Overlay:** Since Escher was written in javascript, it was quickly decided that a JavaScript library should be employed to provide the necessary overlays to make Escher Interactive. Since both D3.js and jQuery were existing dependencies of Escher, it was decided to use jQuery based on comfort and experience.
5. **Visual Escher Interactive Landing Page:** To make Escher interactive accessible to as many users as possible, a plain website that advertises existing models and maps was needed. This was also done in React (JavaScript) because of familiarity and speed.
## What's in the Repository
There are 4 primary folders in the repository:
1. `bigg_api/`: a RESTful Python webserver (written in Flask) that accesses [BiGG](bigg.ucsd.edu) for basic information on KeGG, Chebi, and formulas that are used to gather other information from KeGG, PDB, and data sources.
2. `description-populator/`: a frontend web app (written in React) that is focused on presenting an easy-to-use interface for populating an Escher JSON model object with additional information collected using the `bigg_api` implementation.
3. `interactive_maps/`: The Escher viewer with an extension that allows for tooltip displays (see [erythrodb.ucsd.edu](erythrodb.ucsd.edu) for a much nicer implementation!). Also includes sample populated map files.
4. `minimal_embedded_map/`: a basic viewer with all the data maps for the demo escher interactive demo page.
# Getting started with the demonstration:
You need a few things, first:
1. Nodejs installed. You can use [nvm](https://github.com/creationix/nvm) to install nodejs.
2. Install npm (this should come with nodejs)
Clone the repo:
```bash
git clone https://github.com/bjyurkovich/escher-interactive.git
```
Go to the `description-populator` folder and install dependencies:
```bash
cd description-populator
npm install
```
Then start the dev server:
```bash
npm start
```
Your browser should open with the frontend.
## BiGG API
### Getting started
Install dependencies:
Make sure you have mysql installed (Ubuntu: `sudo apt-get install mysql-server-5.6`)
```bash
sudo apt-get install libmysqlclient-dev
virtualenv venv
source venv/bin/activate
pip install -r requirements.txt
```
Set up MySQL data for PDB mappings:
```msql
sudo service mysql start
mysql -u[username] -p[password] < data/data-model.sql
```
Depending on your mysql username and password, you will need to specify your database credentials in `configuration/config.py`:
```
config = {
'baseUrl' : 'http://localhost',
'port' : 8001,
"database":{
'username': '[username]',
'password':'[password]',
'database': 'PdbMapping',
'host': 'localhost'
}
}
```
Then load the data into the mysql database:
```
python load_data.py
```
Lastly, start the server:
```
python server.py
```
### Testing
The code contains 2 integration tests written in py.test in an attempt to glorify half-a$$ed testing. Therefore, the server must be run when testing:
```bash
python server
```
and in a different terminal, run
```
py.test test/reactions.py -s -v
```