https://github.com/bluegranite/precisionfda_vah_covid-19
Modeling COVID-19 Risk Factors using Machine Learning of Veteran Healthcare Data
https://github.com/bluegranite/precisionfda_vah_covid-19
Last synced: 11 months ago
JSON representation
Modeling COVID-19 Risk Factors using Machine Learning of Veteran Healthcare Data
- Host: GitHub
- URL: https://github.com/bluegranite/precisionfda_vah_covid-19
- Owner: BlueGranite
- License: gpl-3.0
- Created: 2020-06-26T16:36:18.000Z (about 6 years ago)
- Default Branch: master
- Last Pushed: 2020-08-10T22:55:05.000Z (almost 6 years ago)
- Last Synced: 2025-01-19T16:40:20.235Z (over 1 year ago)
- Language: Jupyter Notebook
- Homepage:
- Size: 55.4 MB
- Stars: 0
- Watchers: 1
- Forks: 1
- Open Issues: 1
-
Metadata Files:
- Readme: README.md
- License: LICENSE
Awesome Lists containing this project
README
# _precisionFDA_ COVID-19 Risk Factor Modeling

Colby T. Ford, Thomas J. Weinandy, David Barnhart, Megan Quinn
The Veterans Health Administration (VHA) Innovation Ecosystem and Food and Drug Administration (FDA) call on the scientific and analytics community to develop and evaluate computational models to predict COVID-19 related health outcomes in Veterans.
## At A Glance
The novel coronavirus disease 2019 (COVID-19) is a respiratory disease caused by a new type of coronavirus, known as “severe acute respiratory syndrome coronavirus 2,” or SARS-CoV-2. On March 11, 2020, the World Health Organization (WHO) declared the outbreak a global pandemic.
The Centers for Disease Control and Prevention (CDC) have identified several groups at elevated risk for severe illness, including people 65 years and older, individuals living in nursing homes or long term care facilities, and those with serious underlying medical conditions, such as severe obesity, diabetes, chronic lung disease or moderate to severe asthma, chronic kidney or liver disease, and immunocompromised individuals. Identifying risk and protective factors for severe COVID-19 illness is crucial to better protect, triage, and treat at-risk individuals.
In this regard, the U.S. Department of Veterans Affairs (VA) has implemented several measures in response to the pandemic to protect and care for Veterans, including developing a COVID-19 response plan, administering over 165,000 COVID-19 tests, implementing outreach, screening, and protective procedures to prevent transmission, and supporting non-VA health care facilities. These steps are crucial to protect the Veteran population that has a higher prevalence of several of the known risk factors for severe COVID-19 illness, such as advanced age, heart disease, and diabetes.
To better understand the risk and protective factors in the Veteran population, the VHA Innovation Ecosystem and precisionFDA are calling upon the public to develop machine learning and artificial intelligence models to predict COVID-19 related health outcomes, including COVID-19 status, length of hospitalization, and mortality, using synthetic Veteran health records. Through this challenge, additional risk and protective factors will be investigated, including therapeutics prescribed for preexisting comorbidities, and treatment interactions.
For more information about the challenge, visit the precisionFDA challenge site.
## Our Approach
The Data + AI team at BlueGranite has leveraged Azure cloud-based tools and large-scale machine learning for formulating predictions for the VHA Innovation Ecosystem and precisionFDA COVID-19 Risk Factor Modeling Challenge. We primarily utilized Azure Databricks with the Apache Spark engine and MLlib library for performing the data preparation and machine learning. This allows for highly scalable data transformations and shaping, modeling, and data scoring.
For all five of the constituent use cases of this challenge, we pre-shaped the synthetic medical record data provided by the challenge and then used this common dataset for training the models. Specifically, we rolled up each table to the patient level by pivoting the data. (Only data prior to 2020 was used.)
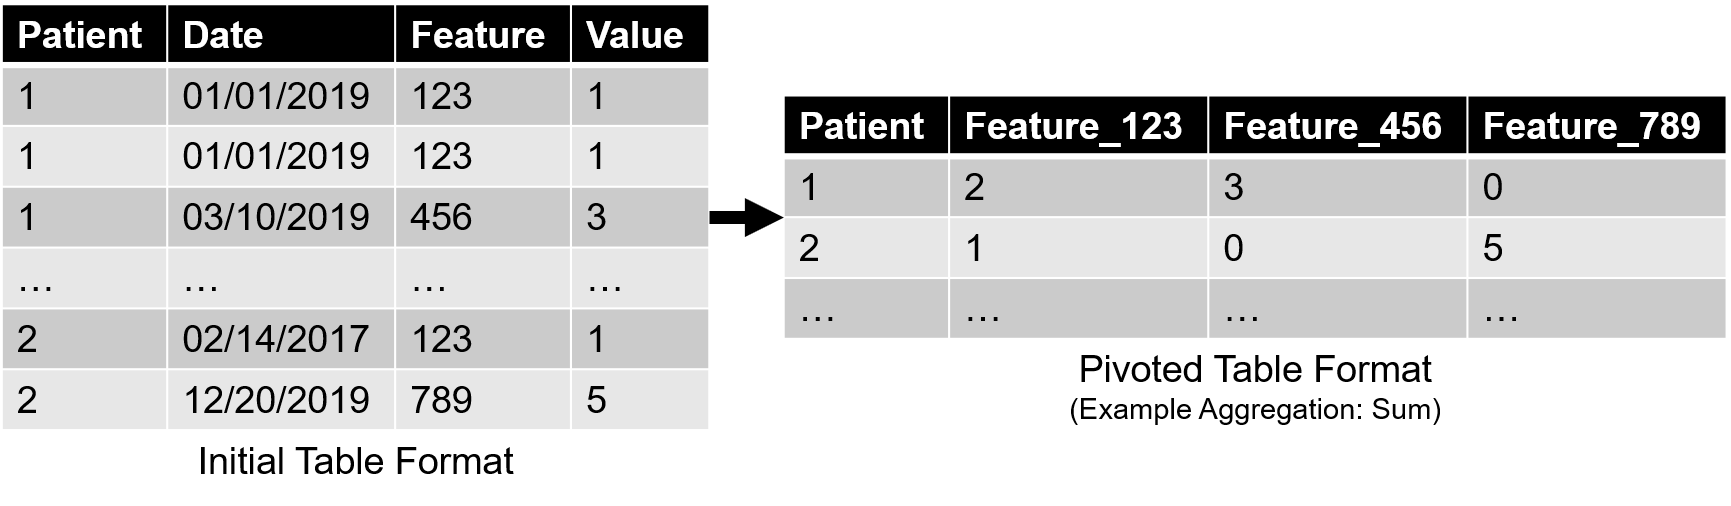
The Observations table was pivoted and minimum, maximum, average, and standard deviation features were derived for each of the observations. Smoking status was aggregated to the patient-level by taking the latest smoking status to date.
A dataset of city demographics was retrieved from the Synthea Github repository. This data was aggregated to the city-level and joined to the main challenge data by city.
All of these pivoted datasets were joined to the patient data to generate a summarized full medical view of each individual. This common patient information dataset was then joined to the individual dependent variable information for each of the constituent use cases, thus generating five training datasets.
| Table | Transformation | Resulting Shape |
|:-----------------------------------------------:|:------------------------------------------------------------------------------:|:----------------------------------------------------------------------------------:|
| Allergies | Pivoted, Presence/Absence by Allergy | Patient ID, Dataset 15 Allergy Columns |
| Care Plans | Pivoted, Presence/Absence by Care Plan | Patient ID, Dataset 35 Care Plan Columns |
| Conditions | Pivoted, Presence/Absence by Condition | Patient ID, Dataset 158 Condition Columns |
| Devices | Pivoted, Presence/Absence by Device | Patient ID, Dataset 6 Device Columns |
| Encounters | -Not Used- | N/A |
| Imaging Studies | Pivoted, Presence/Absence by Imaging Study | Patient ID, Dataset 9 Imaging Study Columns |
| Immunizations | Pivoted, Presence/Absence by Immunization | Patient ID, Dataset 17 Immunization Columns |
| Medications | Pivoted, Sum by Medication | Patient ID, Dataset 166 Medication Columns |
| Observations | Pivoted, Count by Observation (except Smoker Status: Latest Status) | Patient ID, Dataset 203 Observation Columns, 1 Smoker Status Column |
| Organizations | -Note Used- | N/A |
| Patients | None. Removal of unnecessary columns. | Patient ID, Dataset 12 Patient Information Columns |
| Payer Transitions | -Not Used- | N/A |
| Payers | -Not Used- | N/A |
| Procedures | Pivoted, Count by Procedure | Patient ID, Dataset 164 Procedure Columns |
| Providers | -Not Used- | N/A |
| Supplies | -Not Used- | N/A |
| External: City Demographics [Source] | Aggregated to City Level | 42 City-Level Columns |
| | Total | 828 Columns |
## Modeling Submissions
- __Submission 1:__ General Spark MLlib Modeling - [README](/submissions/Submission1_6-26-2020_General)
- __Submission 2:__ XGBoost Modeling of Worst Performing Models from Submission 1 - [README](/submissions/Submission2_7-1-2020_XGBoost)
- __Submission 3:__ Conditional Scaling of Submission 1 Results - [README](/submissions/Submission3_7-2-2020_Conditional)
## Data
All data used in this challenge was synthetically derived using [Synthea™](https://synthetichealth.github.io/synthea/), a patient population simulator from The MITRE Corporation.