https://github.com/bluegreen-labs/skylight
A Simple Sky Illuminance Model
https://github.com/bluegreen-labs/skylight
ephemerides illuminance r r-package rstats sky
Last synced: 10 months ago
JSON representation
A Simple Sky Illuminance Model
- Host: GitHub
- URL: https://github.com/bluegreen-labs/skylight
- Owner: bluegreen-labs
- License: agpl-3.0
- Created: 2022-10-18T19:03:53.000Z (almost 4 years ago)
- Default Branch: main
- Last Pushed: 2025-09-24T13:02:29.000Z (10 months ago)
- Last Synced: 2025-09-25T04:22:50.729Z (10 months ago)
- Topics: ephemerides, illuminance, r, r-package, rstats, sky
- Language: R
- Homepage: https://bluegreen-labs.github.io/skylight/
- Size: 6.59 MB
- Stars: 5
- Watchers: 0
- Forks: 1
- Open Issues: 0
-
Metadata Files:
- Readme: README.md
- Changelog: NEWS.md
- License: LICENSE
Awesome Lists containing this project
README
# Skylight 
[](https://github.com/bluegreen-labs/skylight/actions/workflows/check-package.yaml)
[](https://cran.r-project.org/package=skylight)
[](https://cran.r-project.org/package=skylight)
[](https://app.codecov.io/gh/bluegreen-labs/skylight)
[](https://doi.org/10.5281/zenodo.7222045)
The `skylight` package returns sky illuminance parameters for both the sun and
the moon, for a given date/time and location. In addition, ancillary
parameters such as sun and moon azimuth and altitude are provided. The code is
an almost verbatim transcription of the work by Janiczek and DeYoung (1987),
published in the US Naval observatory circular. An online copy of this
manuscripts can be found on the internet archive
().
Very few adjustments to the original code where made to ensure equivalency in
results. As such, most of the naming of the subroutines and variables was
retained. However, some changes were made to the main routine and subroutines
to ensure vectorization of the code to speed up batch processing of data.
With time more detailed information will be added to all functions, including
references to subroutine functions and more transparent variable names, while
limiting variable recycling (a common practice in the original code base).
The code delivers equivalent results with the programme certification values
published in Table A of Janiczek and DeYoung (1987), as such all original
limitations remain (see below).
## How to cite this package in your article
> Hufkens, K. et al. (2023) ‘Evaluating the effects of moonlight on the vertical flight profiles of three western palaearctic swifts’. Royal Society Proceedings B. doi: 10.1098/rspb.2023.0957, in addition reference the original work by Janiczek and DeYoung (1987, see below)
## Limitations
The sky illuminance model by Janiczek and DeYoung (1987) in `skylight` has some limitations:
- Design specifications aimed for 0.5 degrees in angle, or two minutes of times. Last digits should be considered uncertain by one unit.
- At latitudes less than 60 degrees, the model should agree with more refined calculations to within one or two minutes of time. For latitudes above this value the model can produce errors of up to four minutes.
- In some circumstances calculated illuminance values might differ from real light
levels of a factor 10 or more.
- Strong coherence and proper time keeping is required, there is a strong requirement
to provide dates in GMT, corrections based upon latitude (not civil time zone) should
be executed before processing. No warnings are provided.
Yet, overall the model should provide a fast approximation where more computationally expensive models would only provide marginal benefits for most applications.
For a full description of the model I refer to Janiczek and DeYoung (1987).
## Installation
### stable release
To install the current stable release use a CRAN repository:
```r
install.packages("skylight")
library("skylight")
```
### development release
To install the development releases of the package run the following
commands:
``` r
if(!require(remotes)){install.packages("remotes")}
remotes::install_github("bluegreen-labs/skylight")
library("skylight")
```
Vignettes are not rendered by default, if you want to include additional
documentation please use:
``` r
if(!require(remotes)){install.packages("remotes")}
remotes::install_github("bluegreen-labs/skylight", build_vignettes = TRUE)
library("skylight")
```
## Use
### Single date/time and location
skylight values can be calculated for a single point and date using the below call. This will generate a data frame with model values.
```r
# load the library
library(skylight)
# calculate sky illuminance values for
# a single date/time and location
df <- skylight(
longitude = -135.8,
latitude = -23.4,
date = as.POSIXct("1986-12-18 21:00:00", tz = "GMT"),
sky_condition = 1
)
```
### Multiple dates/times and/or locations
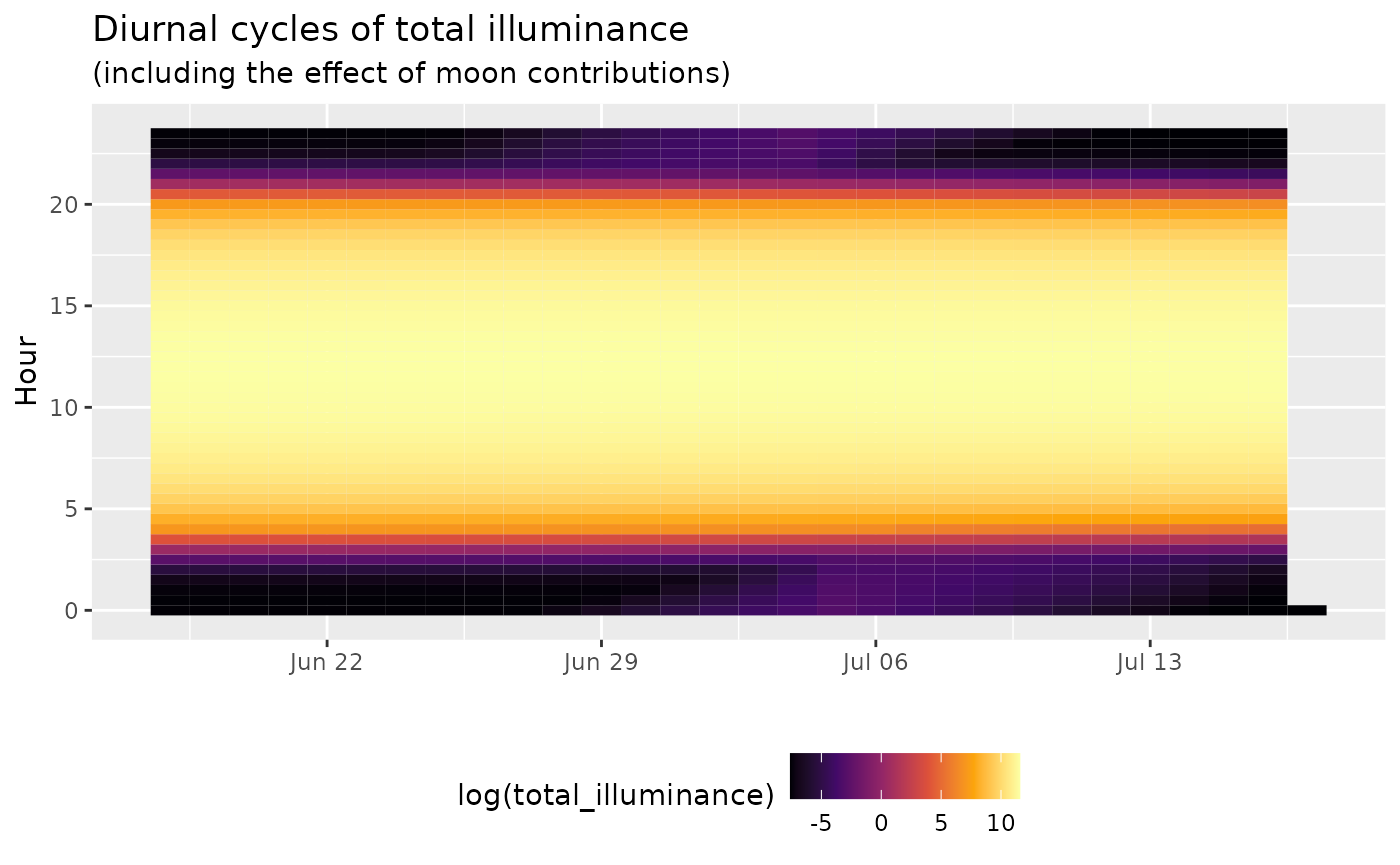
The skylight function is vectorized, so you can provide vectors of input parameters instead of using a loop and the above function call.
```r
# Generate a dataset with 15 minute values
# for approximately two months
input <- data.frame(
longitude = 0,
latitude = 50,
date = as.POSIXct("2020-06-18 00:00:00", tz = "GMT") + seq(0, 60*24*3600, 900),
sky_conditions = 1
)
# calculate sky illuminance values for
# a single date/time and location
df <- skylight(
input$longitude,
input$latitude,
input$date,
1
)
# previous results are of the same dimension (rows)
# as the input data and can be bound together
# for easy plotting
input <- cbind(input, df)
```
Plotting this data results in
### Piped data workflow
`skylight` supports piped data frames with appropriatedly named columns as input
to the function. This allows for fast processing of large data frames, with the
added advantage that input parameters are returned with the calculated data.
Note that you need a data frame with the three most basic parameters:
- longitude
- latitude
- date
named as such (all lower case). The function will complain if it doesn't
find the required column names. Also note that due to the priority of the
piped construction over the other parameters all parameters should be named
when calling the function in a conventional way.
```r
# recreating the data frame with parameters
# as before
input <- data.frame(
longitude = 0,
latitude = 50,
date = as.POSIXct("2020-06-18 00:00:00", tz = "GMT") + seq(0, 1*24*3600, 1800),
sky_condition = 1
)
# but now using the piped approach to calculate
# all values
df <- input |> skylight()
```
### Speed and other considerations
The current code, using the vectorized piped approach, is sufficiently fast to
support larger data sets. For example a more advanced cloud cover correction is
described in the vignettes and taking this analysis as inspiration animations
of illuminance can be made (as shown below).
## Licensing
The `skylight` package is distributed under a AGPLv3 license, while the skylight model code resides in the public domain made available by Janiczek and DeYoung (1987). The logo is in part based upon Emoji One v2.0 iconography.
## References
- Janiczek and DeYoung (1997). [Computer Programs for Sun and
Moon Illuminance With Contingent Tables and Diagrams](https://archive.org/details/DTIC_ADA182110),
US Naval observatory circular nr. 171, 1987