https://github.com/bmcfee/lsd_viz
Laplacian structural decomposition music visualization
https://github.com/bmcfee/lsd_viz
Last synced: about 1 year ago
JSON representation
Laplacian structural decomposition music visualization
- Host: GitHub
- URL: https://github.com/bmcfee/lsd_viz
- Owner: bmcfee
- License: mit
- Created: 2014-10-13T19:33:51.000Z (almost 12 years ago)
- Default Branch: main
- Last Pushed: 2020-06-06T19:00:16.000Z (about 6 years ago)
- Last Synced: 2025-04-15T07:41:38.195Z (over 1 year ago)
- Language: CSS
- Size: 240 KB
- Stars: 22
- Watchers: 4
- Forks: 8
- Open Issues: 1
-
Metadata Files:
- Readme: README.md
- License: LICENSE.md
Awesome Lists containing this project
README
Laplacian structural decomposition music visualization
======================================================
[](https://zenodo.org/badge/latestdoi/25174270)
LSD_VIZ is a web-based, multi-level music structure analysis visualizer.
The analysis is based on the spectral clustering algorithm of
> [McFee, Brian, and Dan Ellis. "Analyzing Song Structure with Spectral Clustering." ISMIR. 2014.](https://bmcfee.github.io/papers/ismir2014_spectral.pdf)
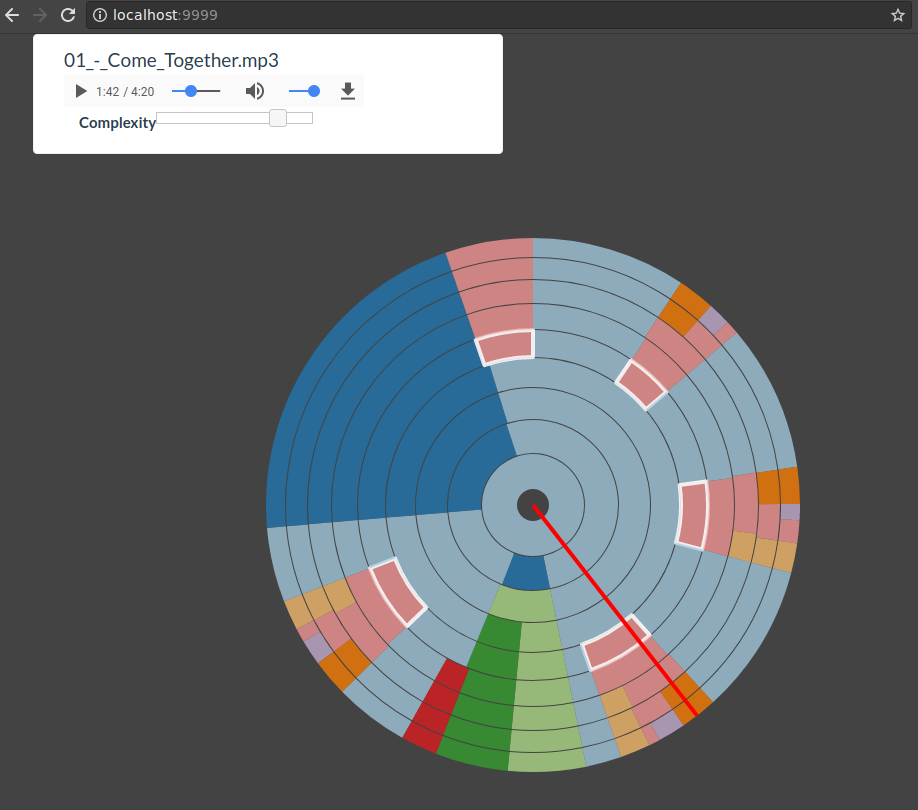
Here's how it looks on *The Beatles - Come Together*:
Installation
============
1. Clone the repository: `git clone https://github.com/bmcfee/lsd_viz.git lsd_viz`
2. Enter the directory: `cd lsd_viz`
3. Install the requirements: `pip install -r requirements.txt`
Usage
=====
To analyze a song, run the following command:
```
python lsd_viz.py /path/to/your_song.mp3
```
By default, this will launch a local web server on port 9999. To view the analysis, point your web browser at (http://127.0.0.1:9999/).
To change the port and host configuration, see the command-line options by saying `python lsd_viz.py -h`.
Description
===========
The visualization presents the song's structure as concentric rings, with time arranged clockwise from the top of the ring.
An audio playback widget is provided, and as the song plays, a red play-head will sweep over the visualization.
A slider is provided to control the complexity of the display: the center ring is the simplest (fewest distinct component types), and outer rings illustrate more complex or precise structural elements.
Similar colors within a ring correspond loosely to repetitions of segments: you can click on any segment to jump directly to its beginning, and it will automatically highlight all other repetitions of that segment.