https://github.com/braniii/prettypyplot
Publication-ready figures made easy
https://github.com/braniii/prettypyplot
matplotlib scientific-visualization
Last synced: 4 months ago
JSON representation
Publication-ready figures made easy
- Host: GitHub
- URL: https://github.com/braniii/prettypyplot
- Owner: braniii
- License: bsd-3-clause
- Created: 2021-03-22T16:07:34.000Z (about 5 years ago)
- Default Branch: main
- Last Pushed: 2025-11-25T10:47:15.000Z (7 months ago)
- Last Synced: 2026-02-21T09:01:59.727Z (4 months ago)
- Topics: matplotlib, scientific-visualization
- Language: Python
- Homepage: https://braniii.github.io/prettypyplot/
- Size: 11.2 MB
- Stars: 11
- Watchers: 3
- Forks: 3
- Open Issues: 1
-
Metadata Files:
- Readme: README.md
- Changelog: CHANGELOG.md
- Contributing: docs/contributing.md
- License: LICENSE
- Zenodo: .zenodo.json
Awesome Lists containing this project
README
# prettypyplot
The documentation including an gallery can be found [here](https://braniii.github.io/prettypyplot).
This is a wrapper package for matplotlib to achieve more easily pretty figures.
If you are looking for something complete, this project is nothing for you
but maybe [seaborn](https://seaborn.pydata.org/). The main aspect of this
project is to help me syncing my rcParams files and to stop copy-pasting so
much code.
The aim of this project is to simplify the generation of some simple
pre-defined figures. Almost all code is inspired or taken from the
[matplotlib gallery](https://matplotlib.org/gallery/index.html). If you are a
power user or interested in generating complex figures, this packages is not
ment for you and you should better take a look in the matplotlib gallery
directly.
This project is in an alpha stage, hence it is neither stable nor ready for
production.
> **CAUTION**:
> Starting from version 1.0.0 (which is far in the future) API-breaking
> changes will be made only in major releases. Until then, it can be changed
> in every minor release (see [changelog](#changelog)).
## Features
The most notable features are:
- Tested with matplotlib `3.3`-`3.10`
- figsize specifies size of canvas. So labels, ticks or colorbars are not counted.
- Nice top-aligned outter legends
- New colors
## Usage
This package uses an syntax very close to matplotlib. Hence, it should be
straight forward to use it. Instead of calling a function on the axes itself,
one needs to pass here the axes as an argument (args or kwargs).
### Installation
```python
python3 -m pip install --upgrade prettypyplot
```
or
```python
conda install -c conda-forge prettypyplot
```
or for the latest dev version
```python
python3 -m pip install git+https://github.com/braniii/prettypyplot.git
```
### Usage
```python
import matplotlib.pyplot as plt
import prettypyplot as pplt
pplt.use_style()
fig, ax = plt.subplots()
...
pplt.plot(ax=ax, x, y)
pplt.savefig(output)
```
### Known Bugs
- `plt.subplots_adjust()` does not work with `pplt.savefig(use_canvas_size=True)`
If you find one, please open an issue.
- `pplt.savefig(use_canvas_size=True)` is not compatible with a grid of subplots
### Known Workarounds
The method `pyplot.subplots_adjust()` is not compatible with the option
`use_canvas_size` in `prettypyplot.plot.savefig`,
use instead:
```python
# this doesn't work, use instead gridspec
fig.subplots_adjust(hspace=0)
# use this instead
fig, axs = plt.subplots(..., gridspec_kw={'hspace': 0.000})
```
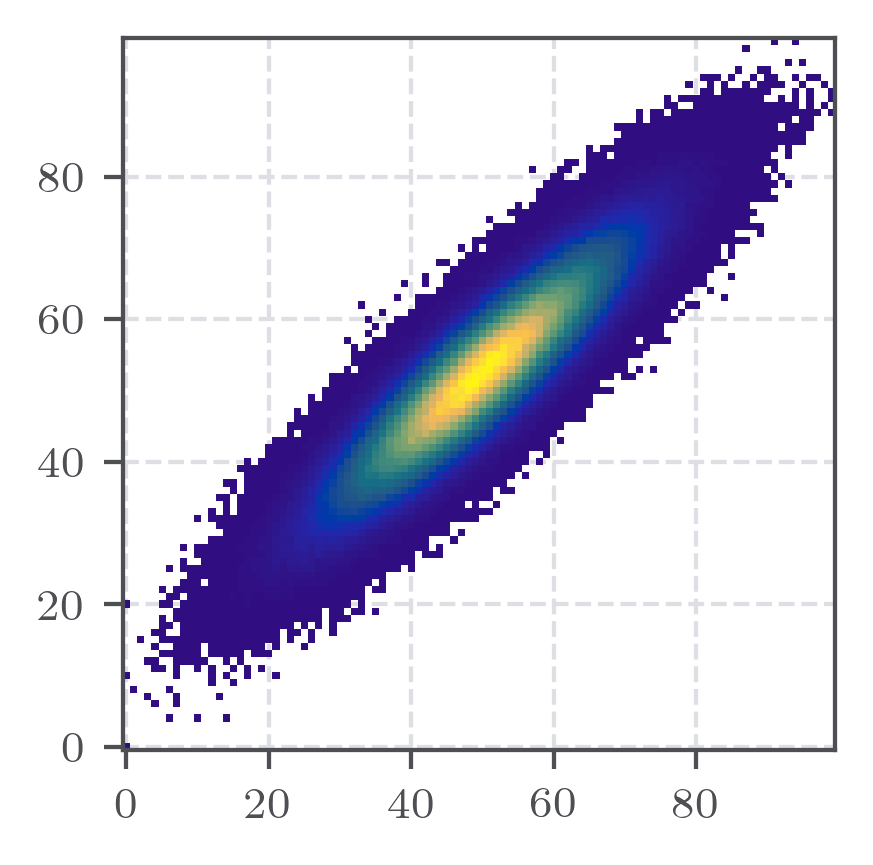
## Comparison to `matplotlib`
matplotlib.pyplot.plot
prettypyplot.plot
matplotlib.pyplot.legend
prettypyplot.legend
matplotlib.pyplot.imshow
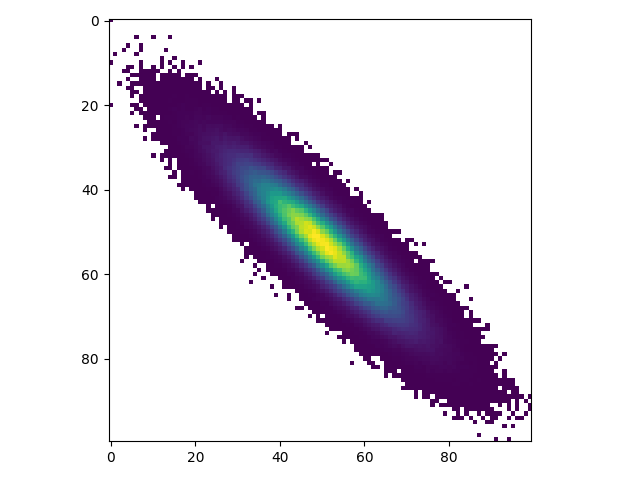
prettypyplot.imshow
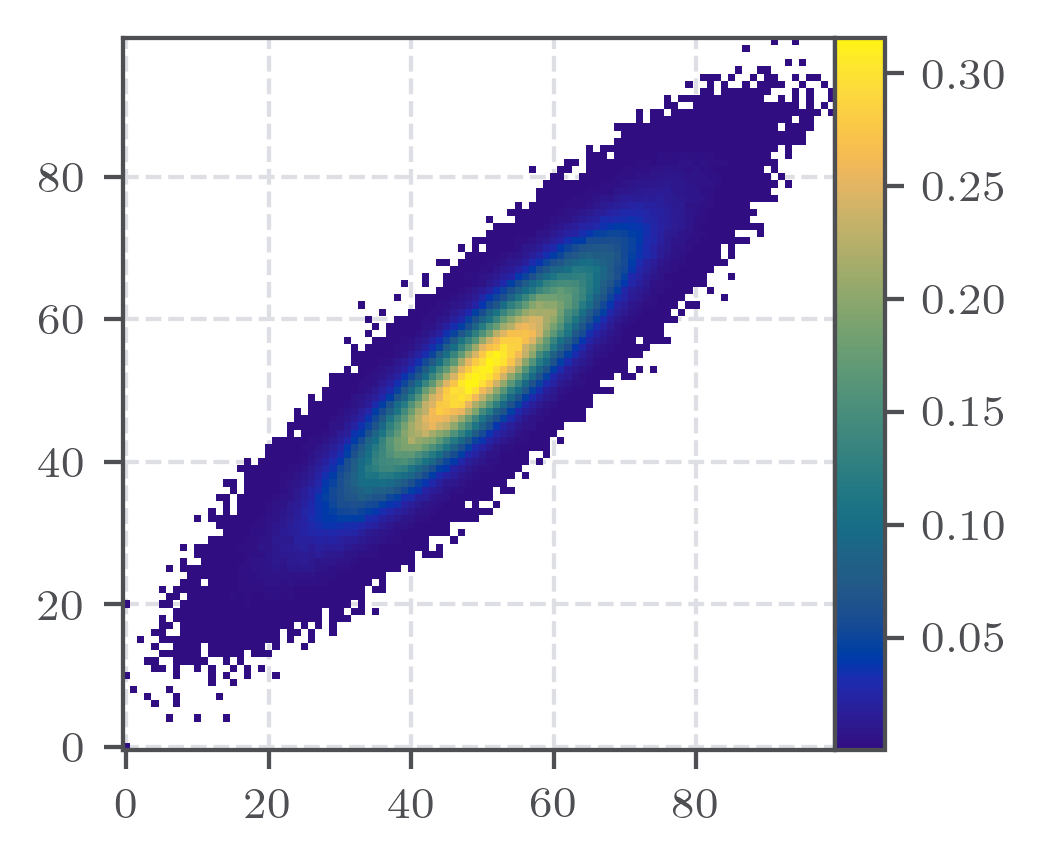
matplotlib.pyplot.colorbar
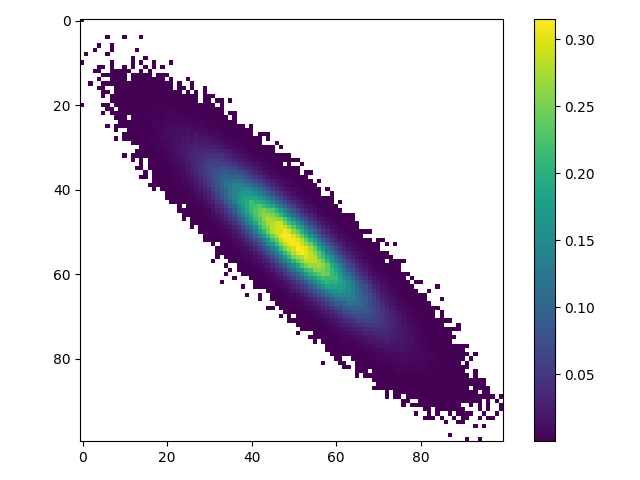
prettypyplot.colorbar
## Roadmap:
The following list is sorted from *near future* to *hopefully ever*.
- [x] add pytest
- [x] add search functionality in doc
- [x] refactoring code to improve readabilty
- [x] add package to conda_forge
- [x] add gallery page
- [x] improve `plt.suplots()` behaviour together with `pplt.savefig()`
- [ ] add more colorpalettes
- [ ] add countour line plot
- [ ] add [axes_grid](https://matplotlib.org/3.1.1/tutorials/toolkits/axes_grid.html) examples
- [ ] setup widths and scaling factors for beamer and poster mode
- [ ] tweak all function to enable `STYLE='minimal'`
- [ ] implement tufte style
## Building Documentation:
The doc is based on [mkdocs](https://mkdocs.org) and can be created by
```bash
# installing all dependencies
python -m pip install -e .[docs]
# serve interactively
python -m mkdocs serve
```
## Similar Projects
- [seaborn](https://seaborn.pydata.org/)
## Citing Prettypyplot
If you want to cite prettypyplot in scientific work please use:
> **Prettypyplot: publication ready matplotlib figures made simple**
> D. Nagel, **2022**. Zenodo:
> [10.5281/zenodo.7278312](https://doi.org/10.5281/zenodo.7278312)
## Credits:
In alphabetical order:
- [colorcyclepicker](https://colorcyclepicker.mpetroff.net/)
- [coolors](https://coolors.co/)
- [matplotlib](https://matplotlib.org/)
- [prettyplotlib](https://github.com/olgabot/prettyplotlib)
- [realpython](https://realpython.com/)
- [viscm](https://github.com/matplotlib/viscm)


