https://github.com/bredefk/icpp
Website for CSAMS data: Charts using PHP Google Graphs | Last solo-jam 48h | IMT2581 - Rapid Prototyping and Innovation
https://github.com/bredefk/icpp
charts jam php polymer prototyping rapid solo
Last synced: 11 months ago
JSON representation
Website for CSAMS data: Charts using PHP Google Graphs | Last solo-jam 48h | IMT2581 - Rapid Prototyping and Innovation
- Host: GitHub
- URL: https://github.com/bredefk/icpp
- Owner: BredeFK
- License: gpl-3.0
- Created: 2019-05-20T10:05:54.000Z (about 7 years ago)
- Default Branch: master
- Last Pushed: 2019-05-21T16:29:01.000Z (about 7 years ago)
- Last Synced: 2024-06-12T17:59:30.315Z (about 2 years ago)
- Topics: charts, jam, php, polymer, prototyping, rapid, solo
- Language: PHP
- Homepage:
- Size: 61.5 KB
- Stars: 1
- Watchers: 1
- Forks: 0
- Open Issues: 0
-
Metadata Files:
- Readme: README.md
- License: LICENSE
Awesome Lists containing this project
README
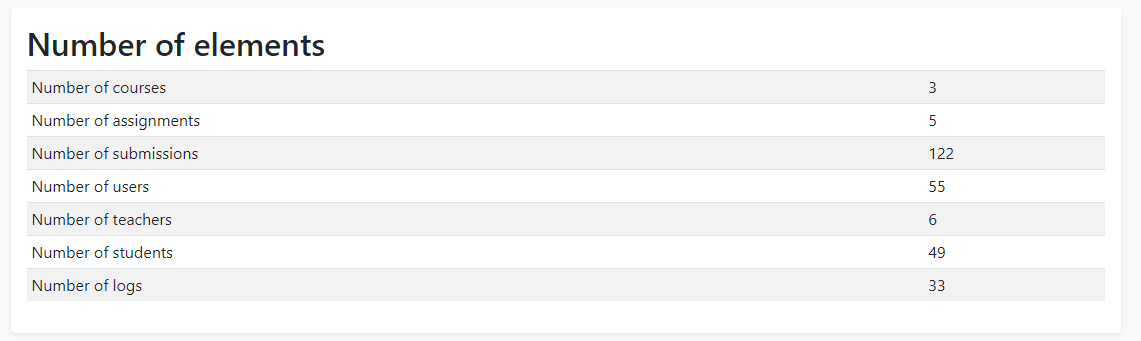
# Graphs using PHP and Google-Graphs
This is my Last solo-jam for the course [IMT2581 - Rapid Prototyping and Innovation](https://www.ntnu.edu/studies/courses/IMT2581/2018/1#tab=omEmnet) with the [IMT2291 - Web Technology](https://www.ntnu.edu/studies/courses/IMT2291#tab=omEmnet) course in mind.
**Changes from original idea**
The original plan was to use polymer and have interactive charts.
* Learning Polymer would have been taking up too much time from the actual development so i skipped that part.
## Note
* This project can be looked as a kind of plugin for my [bachelor project](https://github.com/JohanAanesen/CSAMS) and is for displaying charts of the databse contents.
* It's also to practice for an exam I have that involves PHP, Polymer, Twig and technologies like that.
* I use ex `users.id, users.name, users.email_student, users.teacher, users.email_private` instead of `*` in queries for safer extraction.
* The IDE might say there is some errors in `twig/index.html`, but that's wrong. Everything works
* I lost some time to the sql queries because some of them took longer than expected.
## Requirements
**The requirements was very loose, so I make my own**
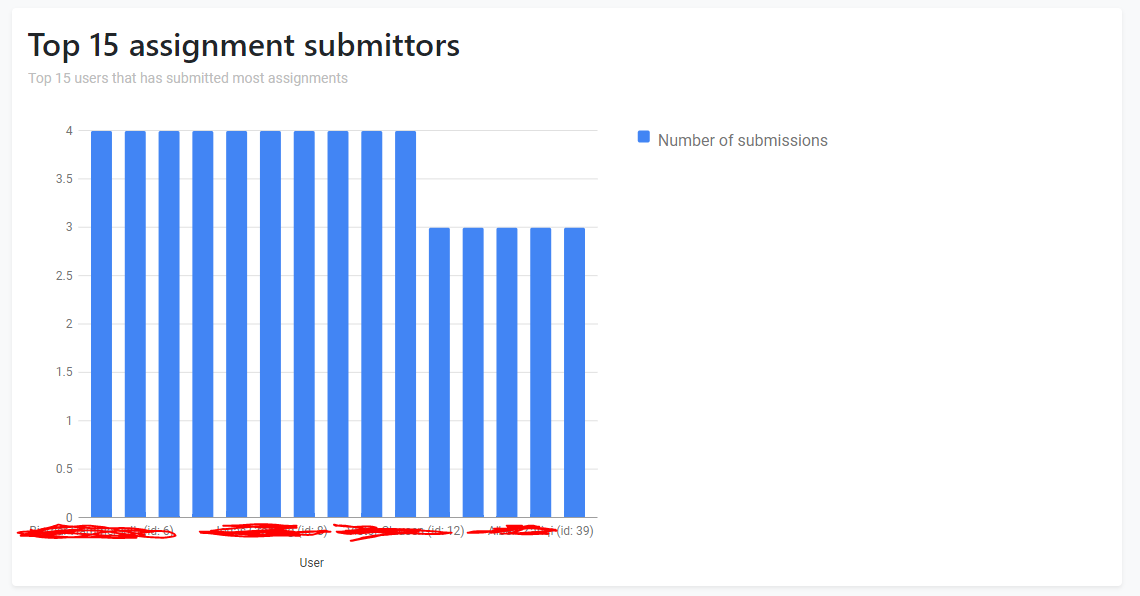
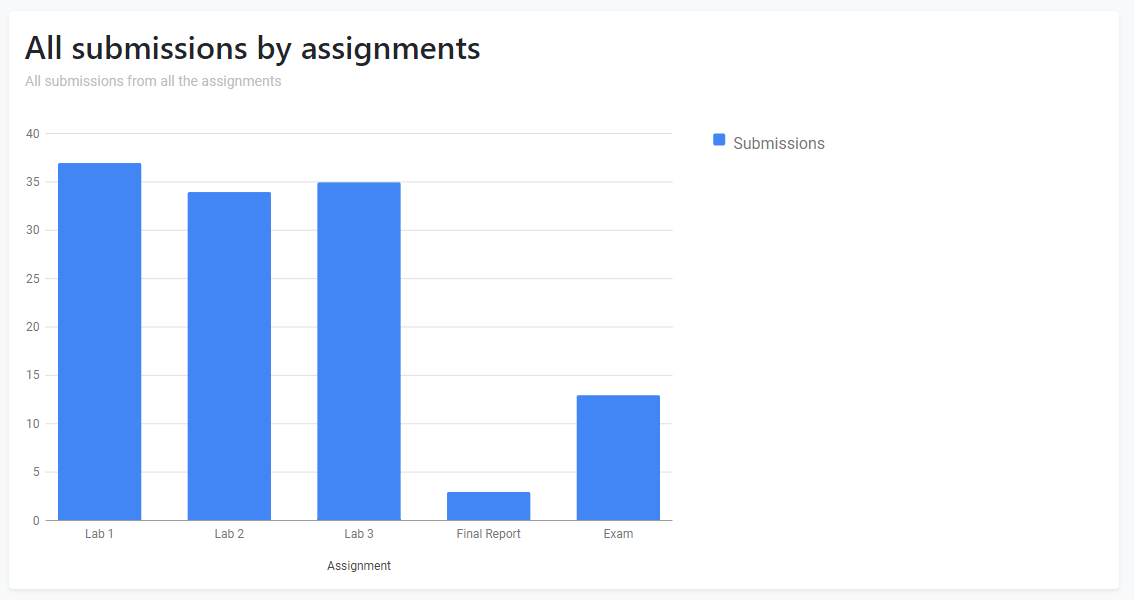
* ~~Get number of delivered submissions(re-deliver too) to the different assignments/courses.~~ This dosen't work beacuse when a user re-deliver or withdraws an assignment and deliver again, the assignment will only be updated. i.e there will always be max one assignment submission for each user.
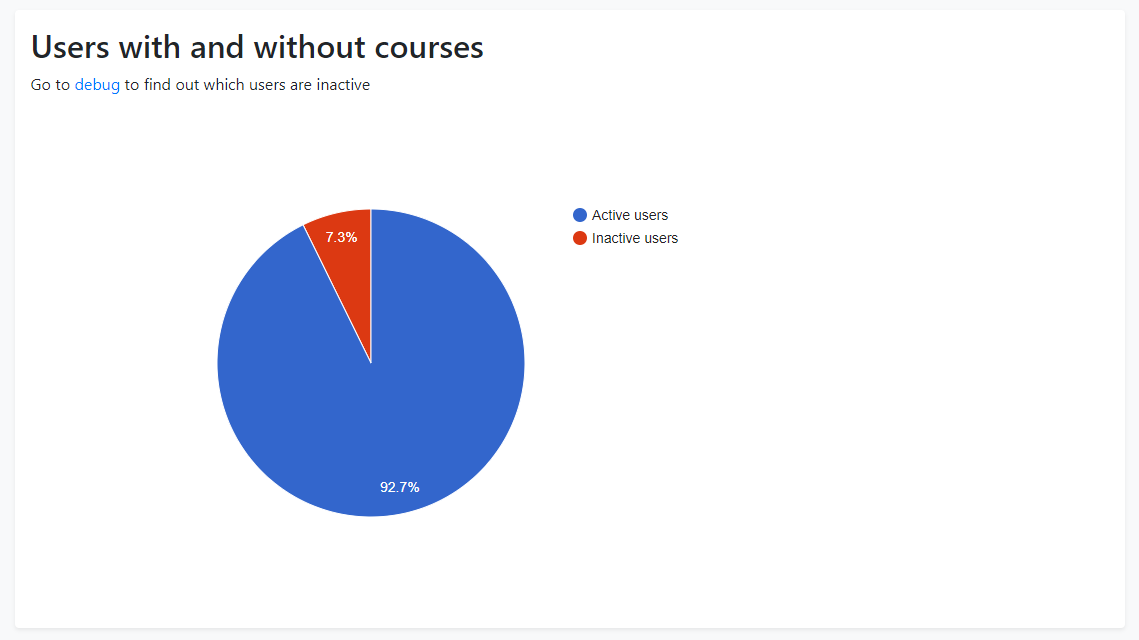
* Get number of 'active' users vs. non active. The users that don't belong to any courses, and put in pie chart + when clicked show list or more info atleast.
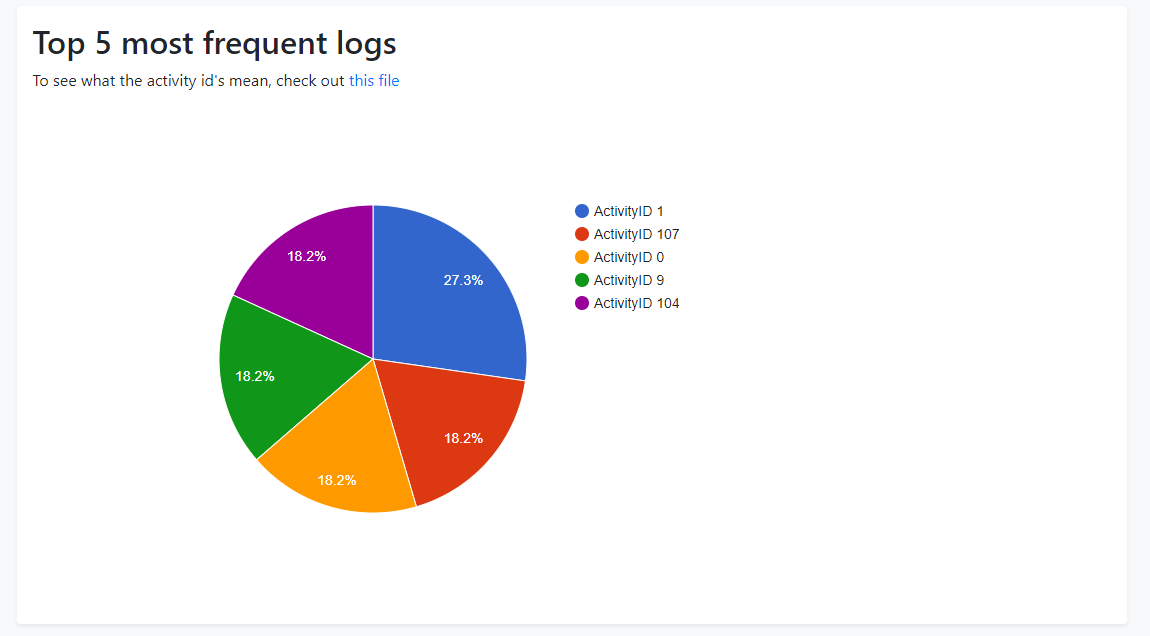
* Get most logged events
## TODO
* Implement twig
* Get more data to create charts with
* Check out `google charts polymer` and implement something like that
* Check out triggers https://developers.google.com/chart/interactive/docs/gallery/piechart
## Installation
1. Clone project in to the folder `C:\xampp\htdocs`
2. Export `cs53` database with settings like this: 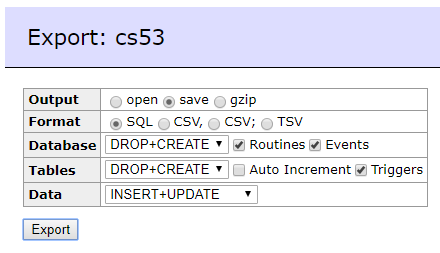
3. Start XAMPP
4. Import database with name `cs53`
5. Run `composer install` in project
6. Go to `localhost/ICPP`
7. Profit
## Sources
1. Former project from [IMT2291](https://www.ntnu.edu/studies/courses/IMT2291#tab=omEmnet) https://github.com/JohanAanesen/MeToobe
2. Bachelor project where the data will come from https://github.com/JohanAanesen/CSAMS
3. https://developers.google.com/chart/interactive/docs/gallery
## Other
I had a lot of techincal issues as I'm kinda new to PHP, twig and polymer.
## Pictures