Ecosyste.ms: Awesome
An open API service indexing awesome lists of open source software.
https://github.com/brentahughes/log-exporter
Prometheus log parser and exporter for auth.log and request logs
https://github.com/brentahughes/log-exporter
grafana logs metrics parse prometheus
Last synced: 4 months ago
JSON representation
Prometheus log parser and exporter for auth.log and request logs
- Host: GitHub
- URL: https://github.com/brentahughes/log-exporter
- Owner: brentahughes
- License: mit
- Created: 2017-12-02T03:15:02.000Z (about 7 years ago)
- Default Branch: master
- Last Pushed: 2018-01-25T18:53:22.000Z (about 7 years ago)
- Last Synced: 2024-09-30T08:02:43.663Z (4 months ago)
- Topics: grafana, logs, metrics, parse, prometheus
- Language: Go
- Homepage:
- Size: 383 KB
- Stars: 7
- Watchers: 2
- Forks: 0
- Open Issues: 0
-
Metadata Files:
- Readme: README.md
- License: LICENSE
Awesome Lists containing this project
README
# Log-Exporter
Simple service for collecting metrics on log files
CURRENTLY ONLY SUPPORT auth.log
### NOTICE
This will add a label for each hostname, ip_address, process, type, and user which can result in a very large number of metrics to track in prometheus. If your server gets a ton of auth attempts you may want to give prometheus more resources or lower the data retention.
## Usage
`./log-exporter -auth.path /path/to/auth.log -request.path /path/to/access.log`
By default metrics will be available at localhost:9090/metrics. This can be changed by using the `-prometheus.port` and `-prometheus.endpoint` flags for your needs.
### Request Log Format
I peronsally proxy all http reqeusts through caddy resulting in a single access.log. This also means my access log format will likely be different from yours. You can use the `-request.regexMatch` flag to set your parser.
*My Access Log Format* [{when}] [{host}] [{remote}] [{status}] [{method}] {uri}"
*The Parser I use* ^\\[.* .0000\\] \\[(?P.*)\\] \\[(?P[0-9\\.]+)\\] \\[(?P\\d{3})\\] \\[(?P\\w+)\\] .*$
- Notice I am using named groups in my regex. Yours will require the same for at least `domain`, `ip_address`, `status`, and `method`. Any others will be ignored.
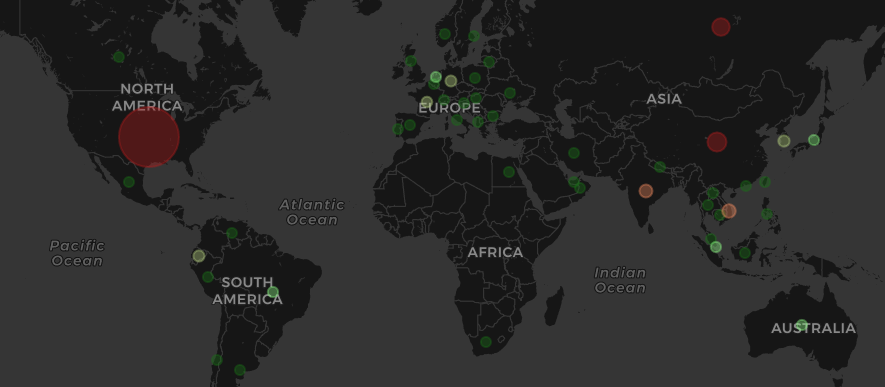
### Geo IP
For location metrics based in the IP addresses found in the log you must have the geoip2 db downloaded somehwere the app can see it.

Extract mmdb file into the same directory as log-exporter
`./log-exporter -auth /path/to/auth.log -geodb /path/to/geoip2.mmdb`
### Debugging
Use the `-debug` flag to proccess the entire log. This will help scan full file and identify any issues
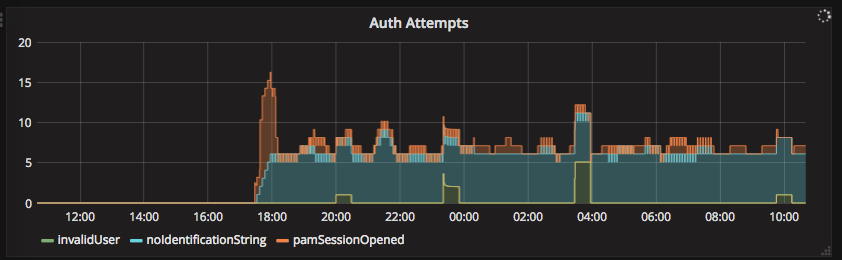
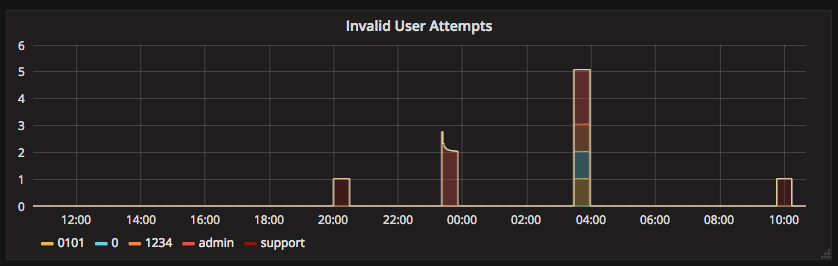
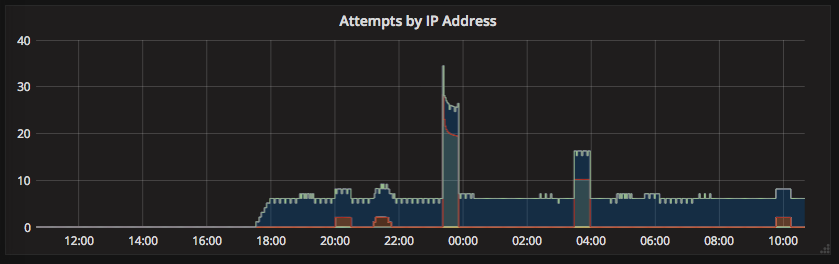
## Screenshots