https://github.com/bro-n-bro/spacebox
https://github.com/bro-n-bro/spacebox
Last synced: 5 months ago
JSON representation
- Host: GitHub
- URL: https://github.com/bro-n-bro/spacebox
- Owner: bro-n-bro
- License: mit
- Created: 2022-12-05T16:03:46.000Z (over 2 years ago)
- Default Branch: main
- Last Pushed: 2025-02-01T14:28:57.000Z (5 months ago)
- Last Synced: 2025-02-01T15:30:15.929Z (5 months ago)
- Size: 2.89 MB
- Stars: 35
- Watchers: 0
- Forks: 4
- Open Issues: 15
-
Metadata Files:
- Readme: README.md
- License: LICENSE
Awesome Lists containing this project
README
# Spacebox Indexator for cosmos sdk-based chains
## Intro
Spacebox is a comprehensive set of open-source tools for data indexation and storage, utilizing the cutting-edge technology of ClickHouse as the foundation for the storage facility. It's built to provide quick access to large data sets and ensure a stable architecture that guarantees data consistency and enables a lightweight setup.
## Architecture
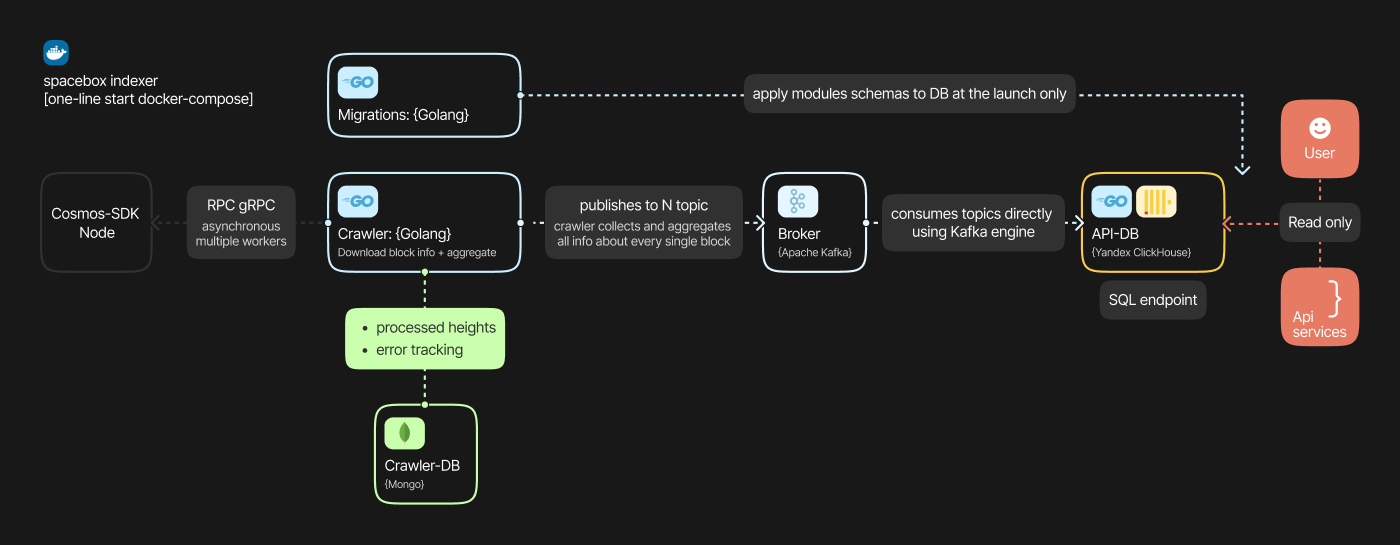
The overall architecture provided on the scheme:

Following [sdk](https://github.com/cosmos/cosmos-sdk/tree/v0.45.13/x) modules supported in current version:
- bank
- core
- auth
- authz
- distribution
- gov
- mint
- staking
- slashing
- feegrant
- ibc
- liquidity
### List of services utilized
1. [Spacebox-crawler](https://github.com/bro-n-bro/spacebox-crawler) - pull and parce blocks, pass them to Kafka
2. Crawler MongoDB - light DB to store crawled blocks status(e.g., OK, Error, missing)
3. Apache Kafka - data broker, a buffer between crawler and main DB
4. ClickHouse - one of the most powerful DB to store indexed data
5. Zookeeper - helps to maintain Kafka cluster *(to remove in release)*
6. Kafka UI - helps to track performance and check *(to remove in release)*
Such architecture was chosen to obtain consistency of data being parsed. Not a single block should be missed, nor a single tx message. Also, separating data processing layers allow relatively easy modification: swap the main DB, for example, to one that suits your project better.
## Run the thing
First of all, you'll need an x86-64 Linux machine, preferably with a fast drive, [Docker engine](https://docs.docker.com/engine/install/), and [Docker-compose](https://docs.docker.com/compose/install/) installed and, of course, the node you're going to pull chain data from.
To start `spacebox` populate `.env` with chain settings like RPC, GRPC, and start \ stop height:
```bash
START_HEIGHT=5048767 # Start block height
STOP_HEIGHT=0 # Stop block height, 0 for actual height
WORKERS_COUNT=15 # go workers to pull data in async mode
SUBSCRIBE_NEW_BLOCKS=true # pull actual blocks
# Chain settings
CHAIN_PREFIX=cosmos # Prefix of indexing chain
WS_ENABLED=true # Websocket enabled
RPC_URL=http://0.0.0.0:26657 # RPC API
GRPC_URL=0.0.0.0:9090 # GRPC API, no HTTP\S prefix
GRPC_SECURE_CONNECTION=false # GRPC secure connection
```
When `.env` is filled to start all containers run:
```bash
docker-compose up -d
```
To stop all containers use:
```bash
docker-compose down
```
Also would be a good idea to give the Docker permissions and ownership for the `./volumes` folder:
*To be fixed in release*
```bash
chown -R 1001:1001 volumes/
```
It usually requires around ~2 minutes to start everything. Check the log of each container with `docker logs ` to see what's going under the hood. Also, it is possible to adjust some parameters on the fly, edit `.env`, and restart the appropriate container.
Also if you're indexing node from the same host machine you may need to add following line to crawlers `docker-compose.yaml` section:
```bash
ports:
- '2112:2112'
extra_hosts:
- "host.docker.internal:host-gateway"
```
and set RPC and GRPC addresses in the `.env` accordingly:
```bash
RPC_URL=http://host.docker.internal:26657
GRPC_URL=host.docker.internal:9090
```
## Monitoring
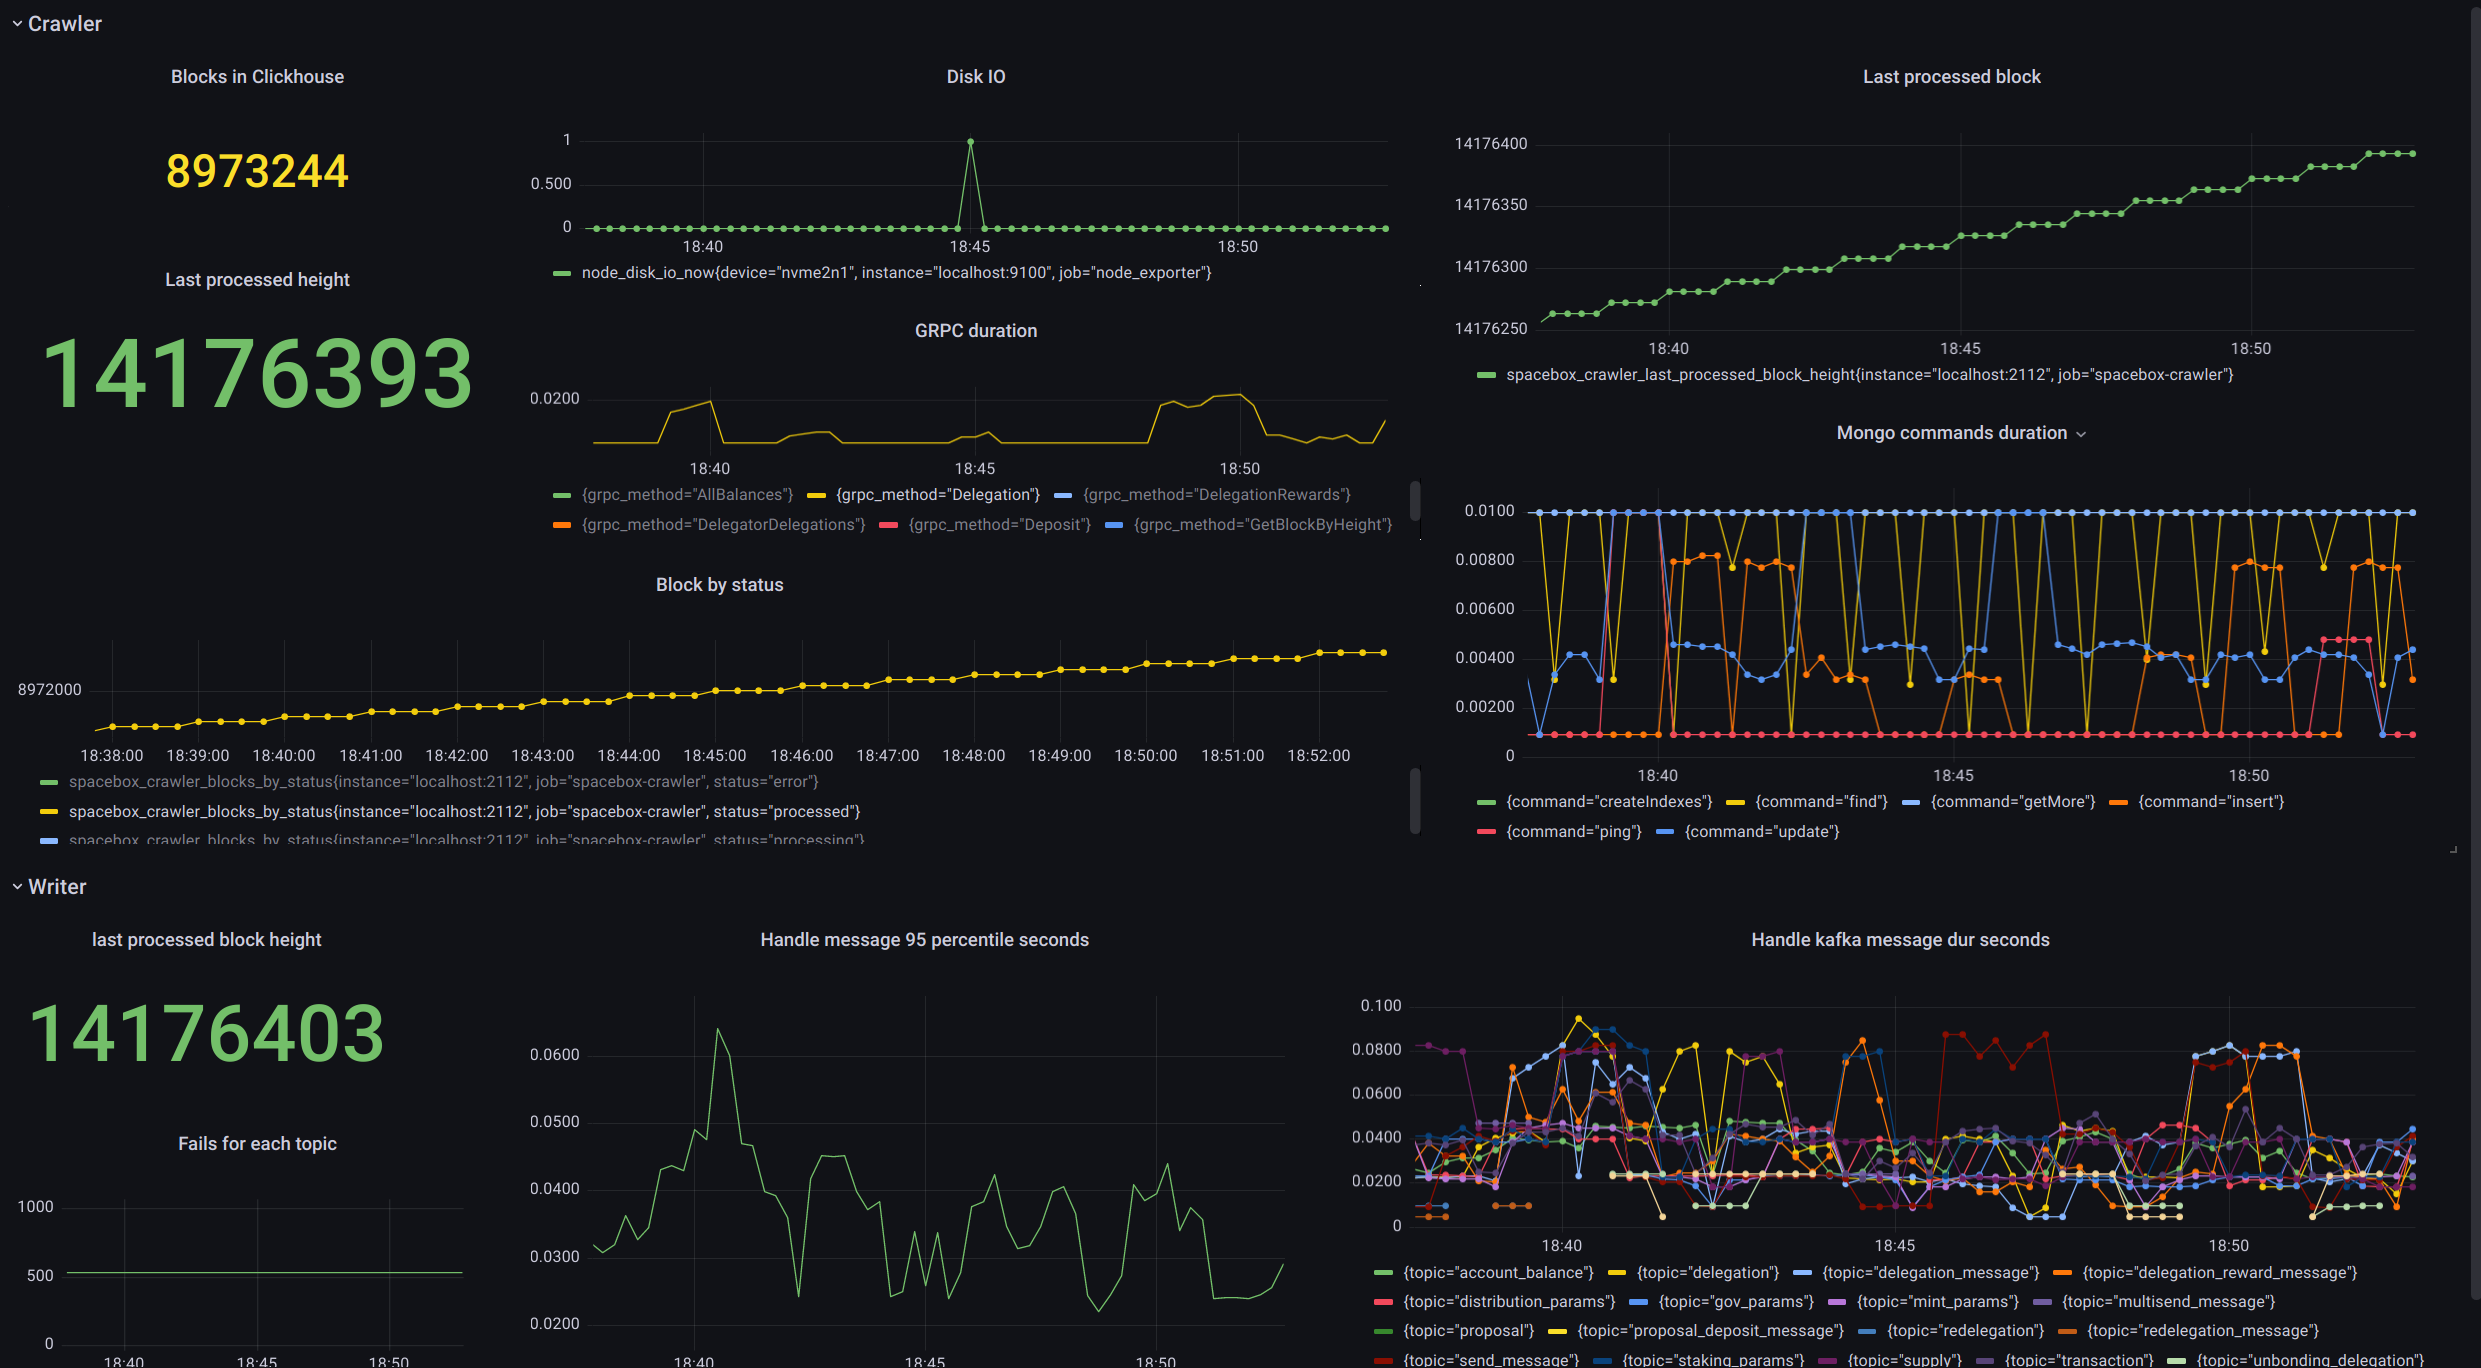
Both spacebox-crawler and spacebox-writer provide some handy Prometheus-compatible metrics for monitoring.
Add the followitg to your [Prometheus](https://github.com/prometheus/prometheus) config:
```bash
- job_name: 'spacebox-crawler'
scrape_interval: 5s
static_configs:
- targets: ['localhost:2112']
```
Example of the [Grafana](https://github.com/grafana/grafana) dashboard:

*TODO: add grafana board json