https://github.com/business-science/anomalize
Tidy anomaly detection
https://github.com/business-science/anomalize
anomaly anomaly-detection decomposition detect-anomalies iqr r-package time-series
Last synced: over 1 year ago
JSON representation
Tidy anomaly detection
- Host: GitHub
- URL: https://github.com/business-science/anomalize
- Owner: business-science
- Created: 2018-03-19T23:08:52.000Z (over 8 years ago)
- Default Branch: master
- Last Pushed: 2023-12-28T15:19:53.000Z (over 2 years ago)
- Last Synced: 2025-04-02T08:11:08.521Z (over 1 year ago)
- Topics: anomaly, anomaly-detection, decomposition, detect-anomalies, iqr, r-package, time-series
- Language: R
- Homepage: https://business-science.github.io/anomalize/
- Size: 41.9 MB
- Stars: 339
- Watchers: 23
- Forks: 61
- Open Issues: 38
-
Metadata Files:
- Readme: README.Rmd
Awesome Lists containing this project
- fucking-awesome-R - anomalize - Tidy Anomaly Detection using Twitter's AnomalyDetection method. (Machine Learning)
- awesome-R - anomalize - Tidy Anomaly Detection using Twitter's AnomalyDetection method. (Machine Learning)
- awesome-R - anomalize - Tidy Anomaly Detection using Twitter's AnomalyDetection method. (Machine Learning)
README
---
output: github_document
---
# Anomalize is being Superceded by Timetk:
# anomalize 
[](https://github.com/business-science/anomalize/actions/workflows/R-CMD-check.yaml)
[](https://lifecycle.r-lib.org/articles/stages.html)
[](https://app.codecov.io/github/business-science/anomalize?branch=master)
[](https://cran.r-project.org/package=anomalize)


```{r setup, include = FALSE}
knitr::opts_chunk$set(
collapse = TRUE,
comment = "#>",
fig.path = "man/figures/README-",
out.width = "100%",
dpi = 200,
message = F,
warning = F
)
library(anomalize)
library(dplyr) # for pipe
```
The `anomalize` package functionality has been superceded by `timetk`. We suggest you begin to use the `timetk::anomalize()` to benefit from enhanced functionality to get improvements going forward. [Learn more about Anomaly Detection with `timetk` here.](https://business-science.github.io/timetk/articles/TK08_Automatic_Anomaly_Detection.html)
The original `anomalize` package functionality will be maintained for previous code bases that use the legacy functionality.
To prevent the new `timetk` functionality from conflicting with old `anomalize` code, use these lines:
``` r
library(anomalize)
anomalize <- anomalize::anomalize
plot_anomalies <- anomalize::plot_anomalies
```
> Tidy anomaly detection
`anomalize` enables a tidy workflow for detecting anomalies in data. The main functions are `time_decompose()`, `anomalize()`, and `time_recompose()`. When combined, it's quite simple to decompose time series, detect anomalies, and create bands separating the "normal" data from the anomalous data.
## Anomalize In 2 Minutes (YouTube)
Check out our entire [Software Intro Series](https://www.youtube.com/watch?v=Gk_HwjhlQJs&list=PLo32uKohmrXsYNhpdwr15W143rX6uMAze) on YouTube!
## Installation
You can install the development version with `devtools` or the most recent CRAN version with `install.packages()`:
``` r
# devtools::install_github("business-science/anomalize")
install.packages("anomalize")
```
## How It Works
`anomalize` has three main functions:
- `time_decompose()`: Separates the time series into seasonal, trend, and remainder components
- `anomalize()`: Applies anomaly detection methods to the remainder component.
- `time_recompose()`: Calculates limits that separate the "normal" data from the anomalies!
## Getting Started
Load the `anomalize` package. Usually, you will also load the tidyverse as well!
```{r, eval = F}
library(anomalize)
library(tidyverse)
# NOTE: timetk now has anomaly detection built in, which
# will get the new functionality going forward.
# Use this script to prevent overwriting legacy anomalize:
anomalize <- anomalize::anomalize
plot_anomalies <- anomalize::plot_anomalies
```
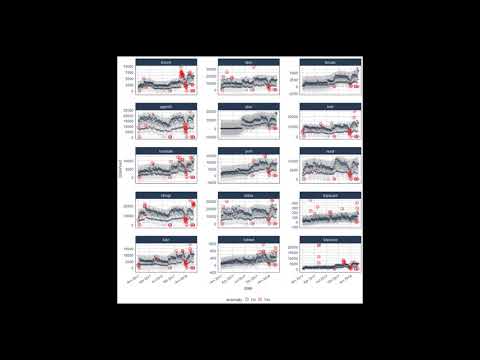
Next, let's get some data. `anomalize` ships with a data set called `tidyverse_cran_downloads` that contains the daily CRAN download counts for 15 "tidy" packages from 2017-01-01 to 2018-03-01.
Suppose we want to determine which daily download "counts" are anomalous. It's as easy as using the three main functions (`time_decompose()`, `anomalize()`, and `time_recompose()`) along with a visualization function, `plot_anomalies()`.
```{r tidyverse_anoms_1, fig.height=8}
tidyverse_cran_downloads %>%
# Data Manipulation / Anomaly Detection
time_decompose(count, method = "stl") %>%
anomalize(remainder, method = "iqr") %>%
time_recompose() %>%
# Anomaly Visualization
plot_anomalies(time_recomposed = TRUE, ncol = 3, alpha_dots = 0.25) +
ggplot2::labs(title = "Tidyverse Anomalies", subtitle = "STL + IQR Methods")
```
Check out the [`anomalize` Quick Start Guide](https://business-science.github.io/anomalize/articles/anomalize_quick_start_guide.html).
## Reducing Forecast Error by 32%
Yes! Anomalize has a new function, `clean_anomalies()`, that can be used to repair time series prior to forecasting. We have a [brand new vignette - Reduce Forecast Error (by 32%) with Cleaned Anomalies](https://business-science.github.io/anomalize/articles/forecasting_with_cleaned_anomalies.html).
```{r}
tidyverse_cran_downloads %>%
dplyr::filter(package == "lubridate") %>%
dplyr::ungroup() %>%
time_decompose(count) %>%
anomalize(remainder) %>%
# New function that cleans & repairs anomalies!
clean_anomalies() %>%
dplyr::select(date, anomaly, observed, observed_cleaned) %>%
dplyr::filter(anomaly == "Yes")
```
## But Wait, There's More!
There are a several extra capabilities:
- `plot_anomaly_decomposition()` for visualizing the inner workings of how algorithm detects anomalies in the "remainder".
```{r, fig.height=7}
tidyverse_cran_downloads %>%
dplyr::filter(package == "lubridate") %>%
dplyr::ungroup() %>%
time_decompose(count) %>%
anomalize(remainder) %>%
plot_anomaly_decomposition() +
ggplot2::labs(title = "Decomposition of Anomalized Lubridate Downloads")
```
For more information on the `anomalize` methods and the inner workings, please see ["Anomalize Methods" Vignette](https://business-science.github.io/anomalize/articles/anomalize_methods.html).
## References
Several other packages were instrumental in developing anomaly detection methods used in `anomalize`:
- Twitter's `AnomalyDetection`, which implements decomposition using median spans and the Generalized Extreme Studentized Deviation (GESD) test for anomalies.
- `forecast::tsoutliers()` function, which implements the IQR method.
# Interested in Learning Anomaly Detection?
Business Science offers two 1-hour courses on Anomaly Detection:
- [Learning Lab 18](https://university.business-science.io/p/learning-labs-pro) - Time Series Anomaly Detection with `anomalize`
- [Learning Lab 17](https://university.business-science.io/p/learning-labs-pro) - Anomaly Detection with `H2O` Machine Learning