https://github.com/caarmen/cycle-plotter
Command line tool to plot a graph of cycles exported from Apple Health or Withings Health Mate.
https://github.com/caarmen/cycle-plotter
health menstrual-tracking
Last synced: 4 months ago
JSON representation
Command line tool to plot a graph of cycles exported from Apple Health or Withings Health Mate.
- Host: GitHub
- URL: https://github.com/caarmen/cycle-plotter
- Owner: caarmen
- License: mit
- Created: 2024-06-01T18:14:02.000Z (about 1 year ago)
- Default Branch: main
- Last Pushed: 2024-06-02T22:46:57.000Z (about 1 year ago)
- Last Synced: 2025-03-17T23:42:24.133Z (4 months ago)
- Topics: health, menstrual-tracking
- Language: Python
- Homepage:
- Size: 1.82 MB
- Stars: 1
- Watchers: 1
- Forks: 1
- Open Issues: 0
-
Metadata Files:
- Readme: README.md
- License: LICENSE
Awesome Lists containing this project
README
## Cycle Plotter


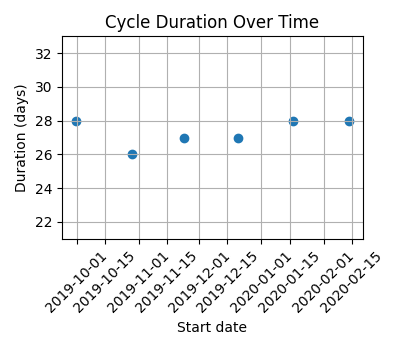
This command-line tool reads data from an Apple Health or Withings Health Mate export, and creates a plot of cycle durations.
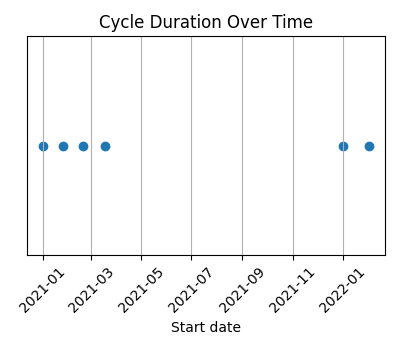
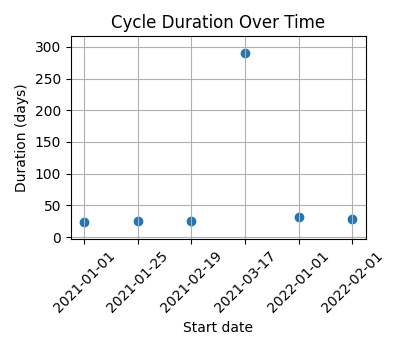
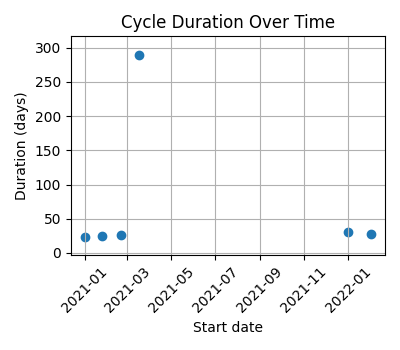
On the x-axis, we have the date at the beginning of a cycle.
On the y-axis, we have the duration of the cycle. The duration of a cycle is the number of days between its start, and the start of the next cycle.
### Sample graphs
The datasets for these graphs were generated by ChatGPT. They don't corespond to any real person.
#### Regular cycles
Cycles covering a period of 6 months, with little variation in cycle length.

#### Pregnancy
Cycles covering a period of just over one year, with a pregnancy during that time.
|`--axis x` | `--axis y` | `--axis both` (default) |
|---|---|---|
| |
| |
| |
|
## Usage
Run the program with the `--help` argument to see the full usage.
```
% python -m cycleplotter.main --help
usage: main.py [-h] -i INPUT_FILE -o OUTPUT_FILE -s {apple,withings} [-a {x,y,both}] [-d DIMENSIONS]
options:
-h, --help show this help message and exit
-i INPUT_FILE, --input-file INPUT_FILE
path to archive exported from
Apple Health or Withings Health Mate
-o OUTPUT_FILE, --output-file OUTPUT_FILE
path to image file to export
-s {apple,withings}, --source {apple,withings}
-a {x,y,both}, --axis {x,y,both}
Indicate the cycle durations on:
x: the x-axis, by horizontal spacing between points
y: the y-axis, by their values
both: both axes
Default both.
-d DIMENSIONS, --dimensions DIMENSIONS
The size of the image to create.
Supported values are:
a4
letter
x
Supported units are in, cm, and px.
Example: 600x400px
Default a4.
```
The program has been tested exporting to png and pdf. But other formats are probably supported. The program uses matplotlib to output the image. The supported file formats may be in the matplotlib [documentation](https://matplotlib.org/stable/api/backend_bases_api.html#matplotlib.backend_bases.FigureCanvasBase.filetypes).
Examples:
Export a png of data from Apple Health, using long arguments:
```shell
python -m cycleplotter.main --input-file ~/Downloads/export.zip --output-file /tmp/cyclegraph.png --source apple
```
Export a pdf of data from Withings Health Mate, using short arguments:
```shell
python -m cycleplotter.main -i ~/Downloads/data_ABC_1717249954.zip -o /tmp/cyclegraph.pdf -s withings
```
## How to get the health data files
See the steps [here](https://github.com/caarmen/cycle-plotter/blob/main/docs/healthdatafiles.md).